A. INTRODUCTION
B. MAPPING CONNECTIONS AND CIRCUITRY ON FLATMAPS
C. CONSTRUCTING THE SWANSON FLATMAPS
D. MAPPING CONNECTIONS ON STANDARD TEMPLATES
E. A FLATMAP TEMPLATE FOR THE COMPLETE RAT CONNECTOME
F. REFERENCES
A. INTRODUCTION
Mercator revolutionized cartography in 1569 by introducing a systematic way of representing the surface of the earth, not on a globe, but on a chart or other two dimensional surface. Although the surface of the earth is distorted, flat maps are extremely popular because they are much more convenient to display and transport, and basic relationships are easier to visualize in two dimensions rather than three.
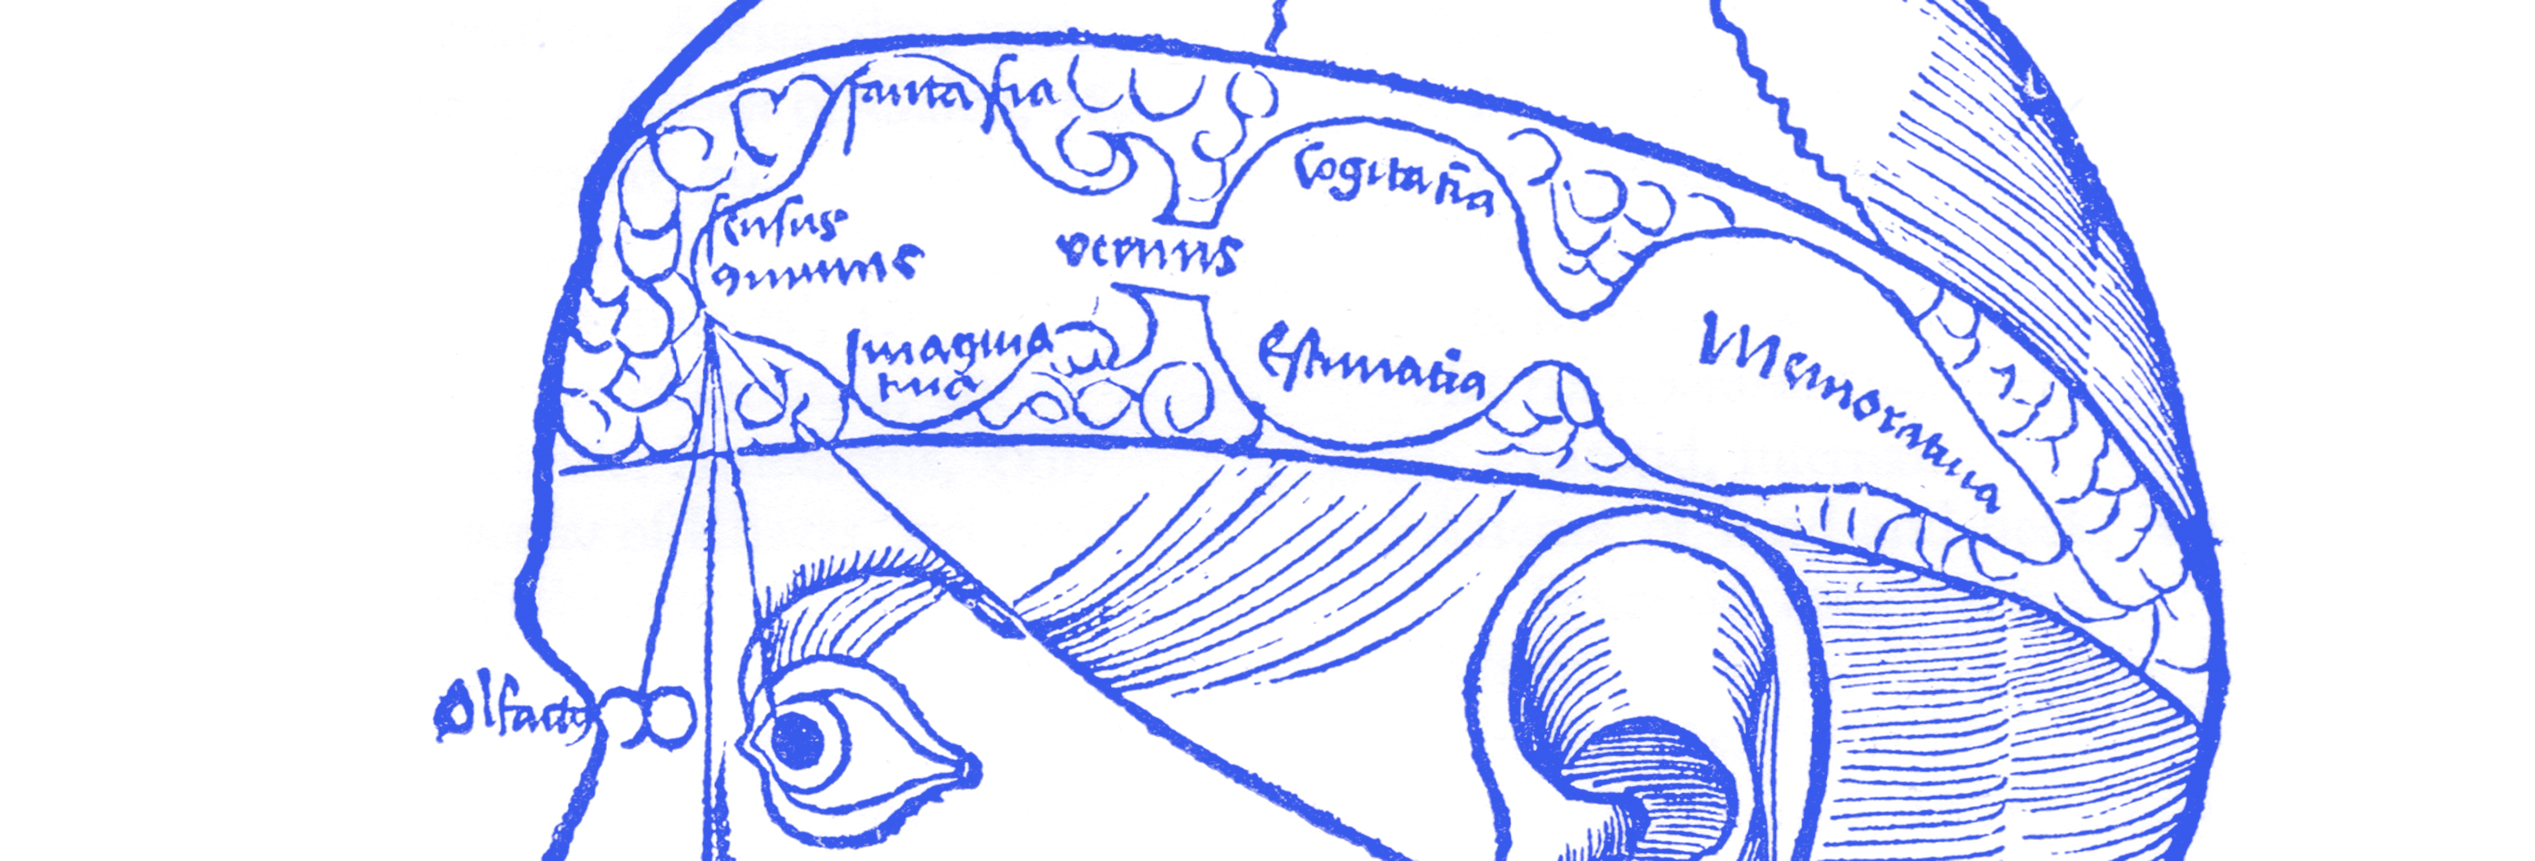
The brain is a complex 3D organ and in principle general spatial relationships would be easier to appreciate in 2D schematic drawings. This has been done to illustrate various components of the brain and nervous system since the Renaissance, using innumerable approaches. However, systematic ways to depict the entire brain on a flatmap, like geographic maps, is a fairly recent development (Swanson, 2000).
The classic example was provided by C. Judson Herrick in his 1948 book, The brain of the tiger salamander, Amblystoma tigrinum. The critical feature Herrick took advantage of was the fact that the central nervous system of this animal is in one respect quite simple, compared to reptiles and mammals. The various gray matter regions are arranged like irregular tiles between the outer surface and the ventricle—they are not stacked (as, for example, in the mammalian thalamus). Thus, one can simply (at least conceptually) cut the central nervous system along the dorsal and ventral midline, and lay out the right or left half, producing an accurate flatmap almost effortlessly.
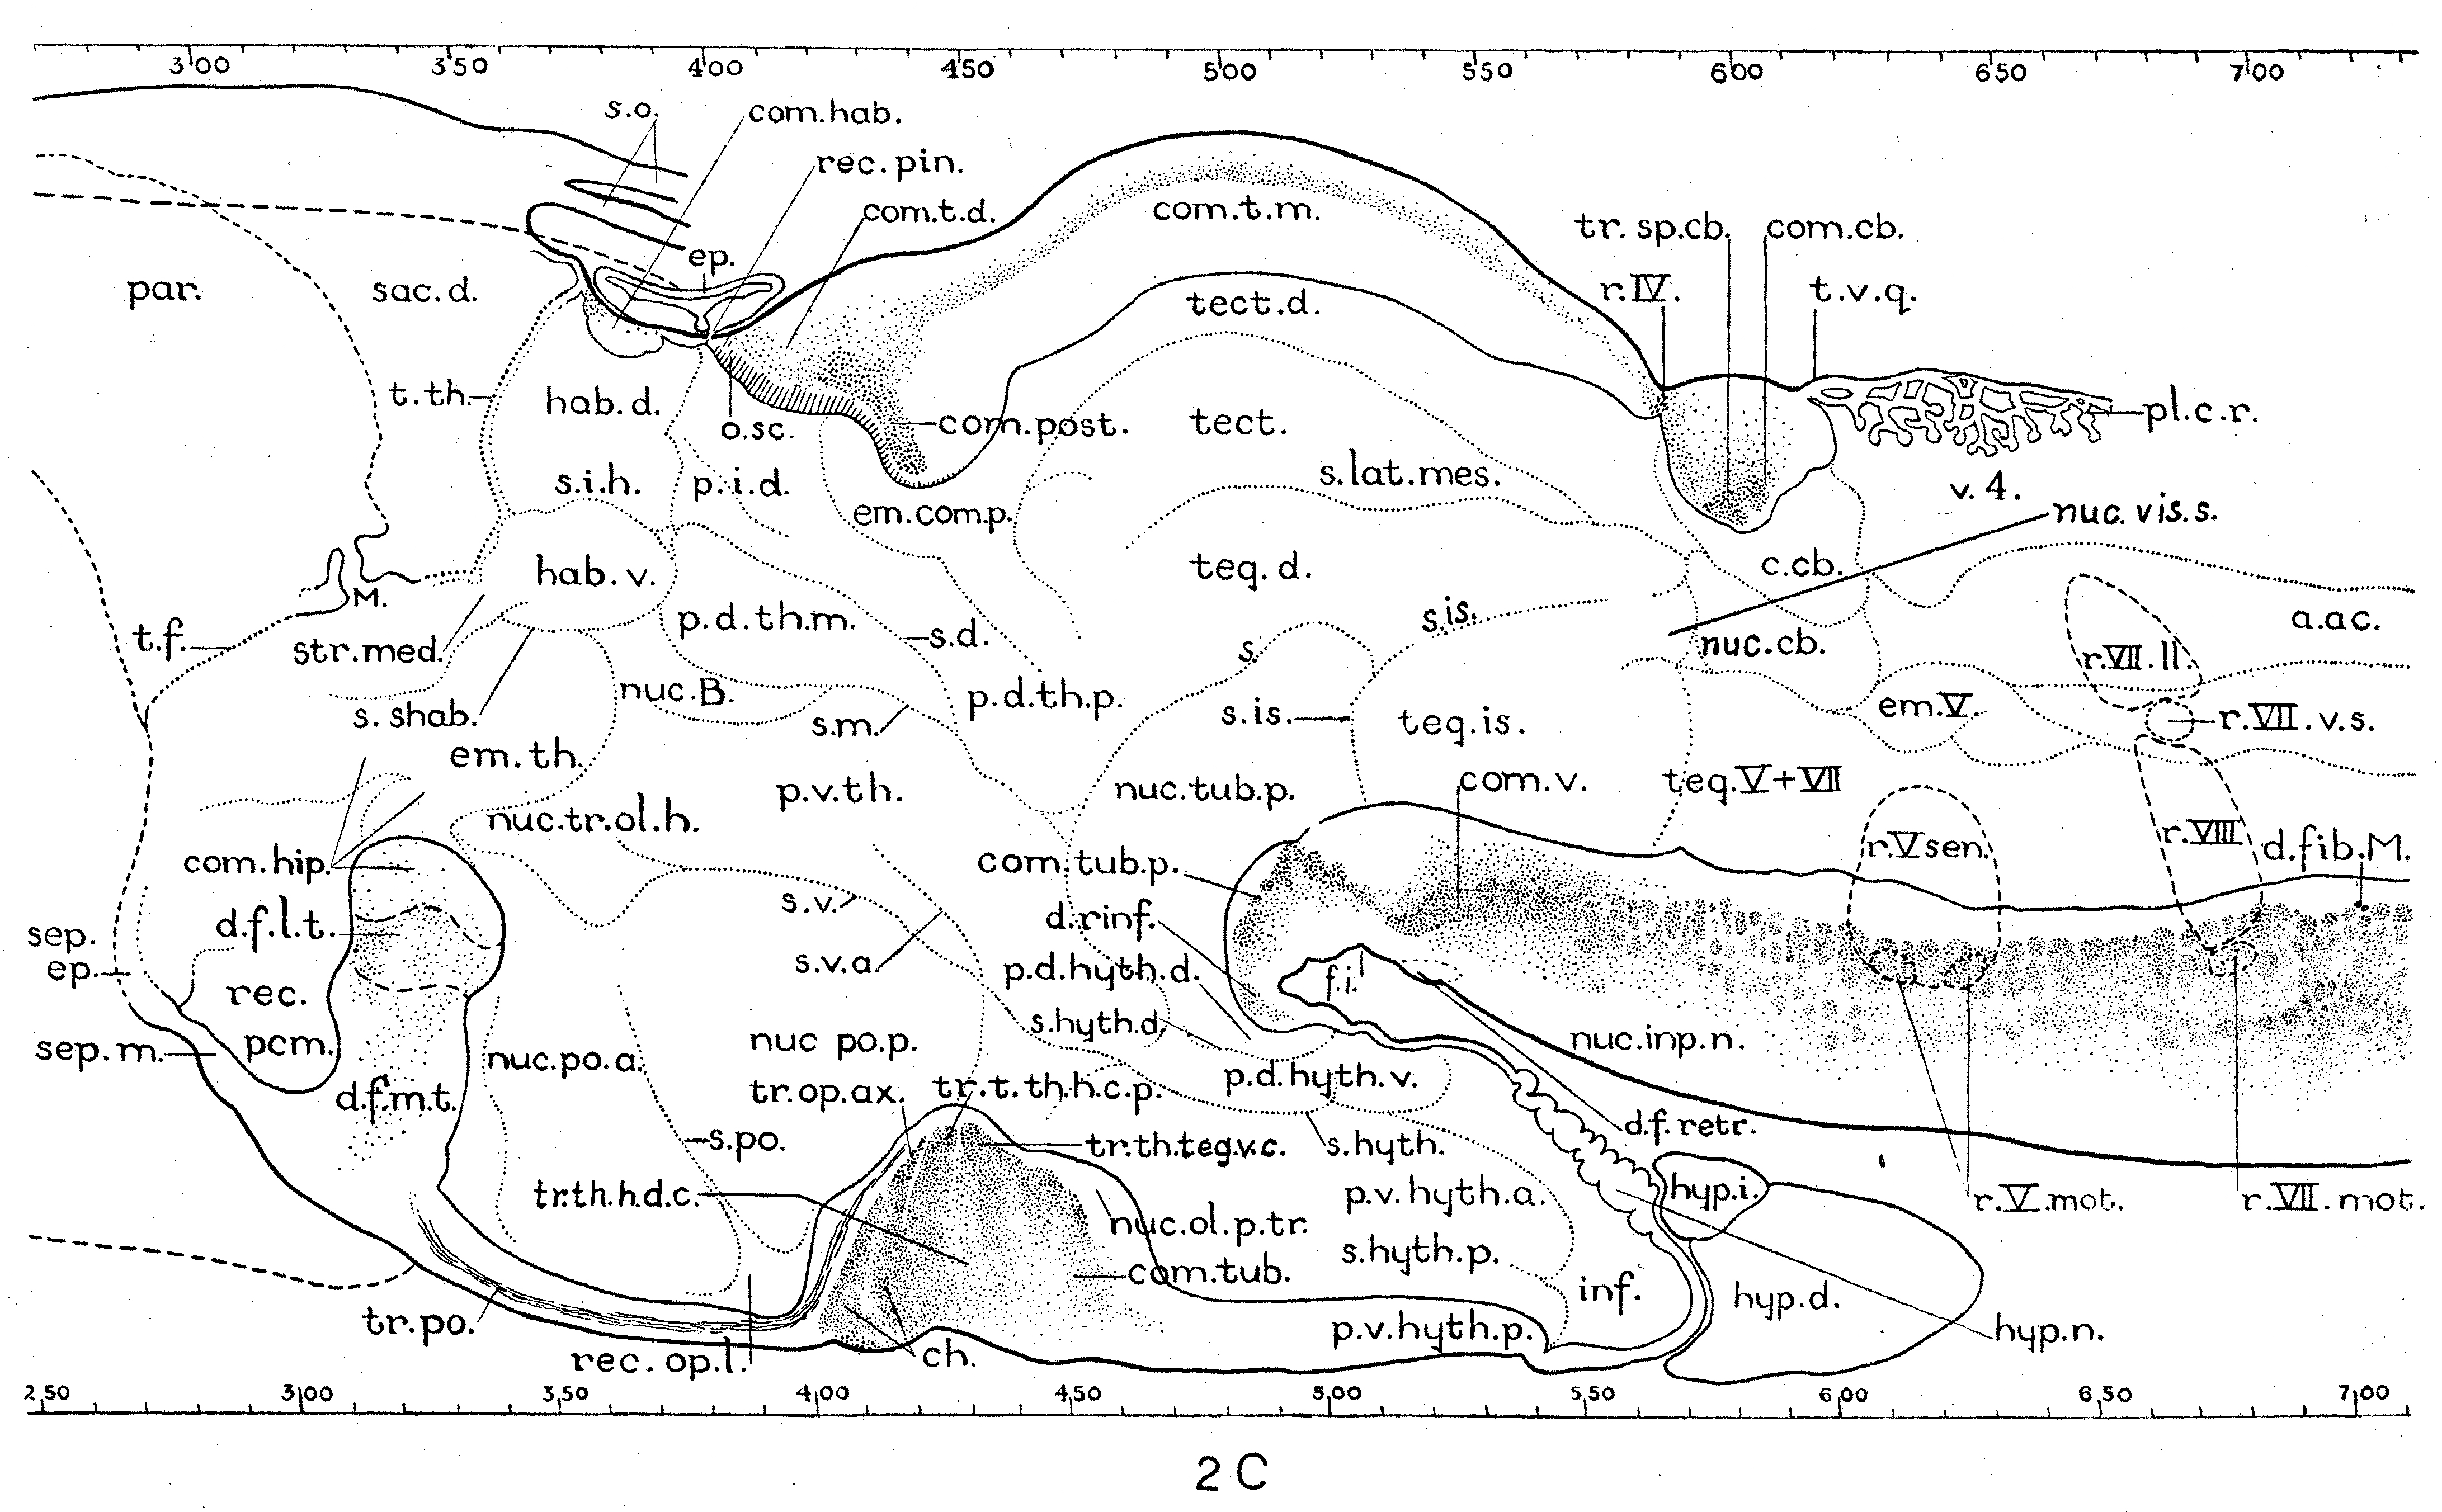 Flatmap of the right brainstem of the tiger salamander (Herrick, 1948).
In 1970 Walle J.H. Nauta and Harvey J. Karten published a flatmap of the generalized mammalian central nervous system, although they did not go into detail about how it was constructed, mostly by Nauta, who used it extensively in his textbook (Nauta & Feirtag, 1986). They affectionately referred to it informally as the “Shmoo Brain”.
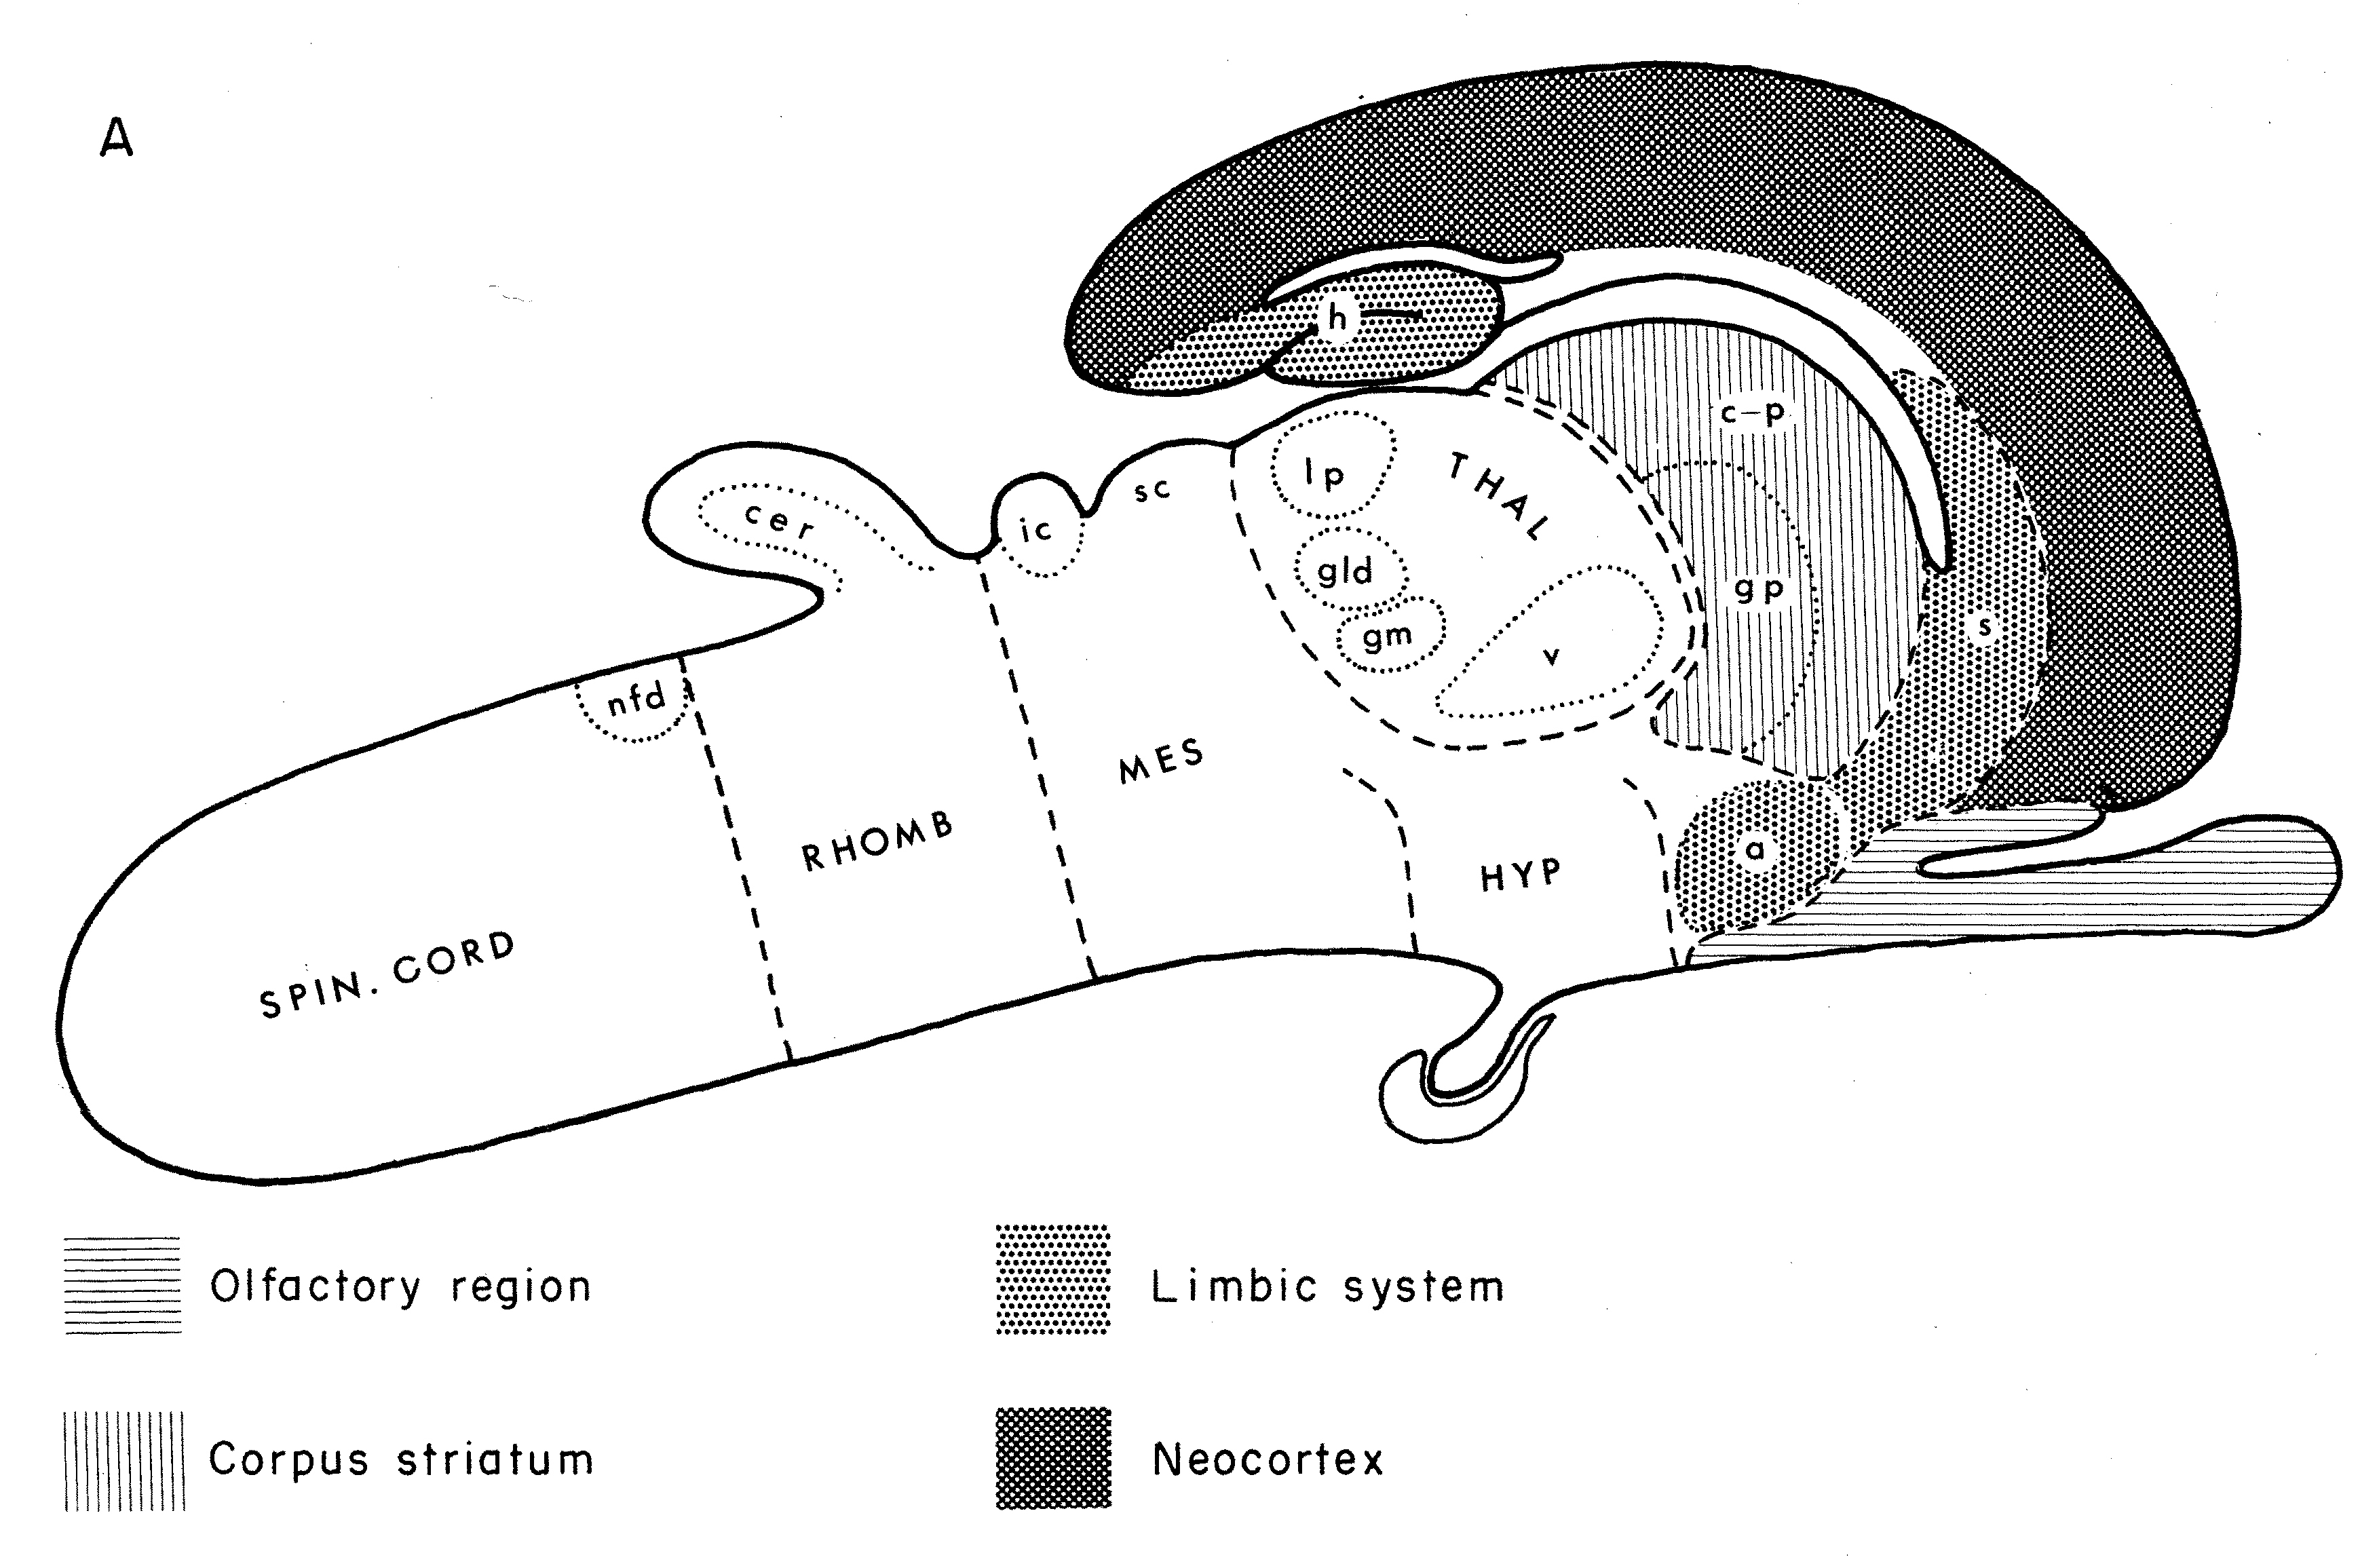 Flatmap of one side of the generalized mammalian central nervous system (Nauta & Karten, 1970).
A third approach was taken by Larry Swanson in 1992. He produced a bilateral flatmap of the rat central nervous system that in essence was a fatemap of the neural plate, from an early stage of embryonic development when the nervous system is topologically a flat sheet, one cell thick (see an “animated” explanation from Swanson, 2018)). The main advantage of this flatmap is that crossed connections can be displayed, and all gray matter differentiations (cell groups or regions) in the accompanying atlas are displayed. Furthermore, because it was created with vector graphics in Adobe Illustrator, it is highly scalable within a small file size. A complementary flatmap of the human central nervous system was introduced two years later (Swanson, 1995).
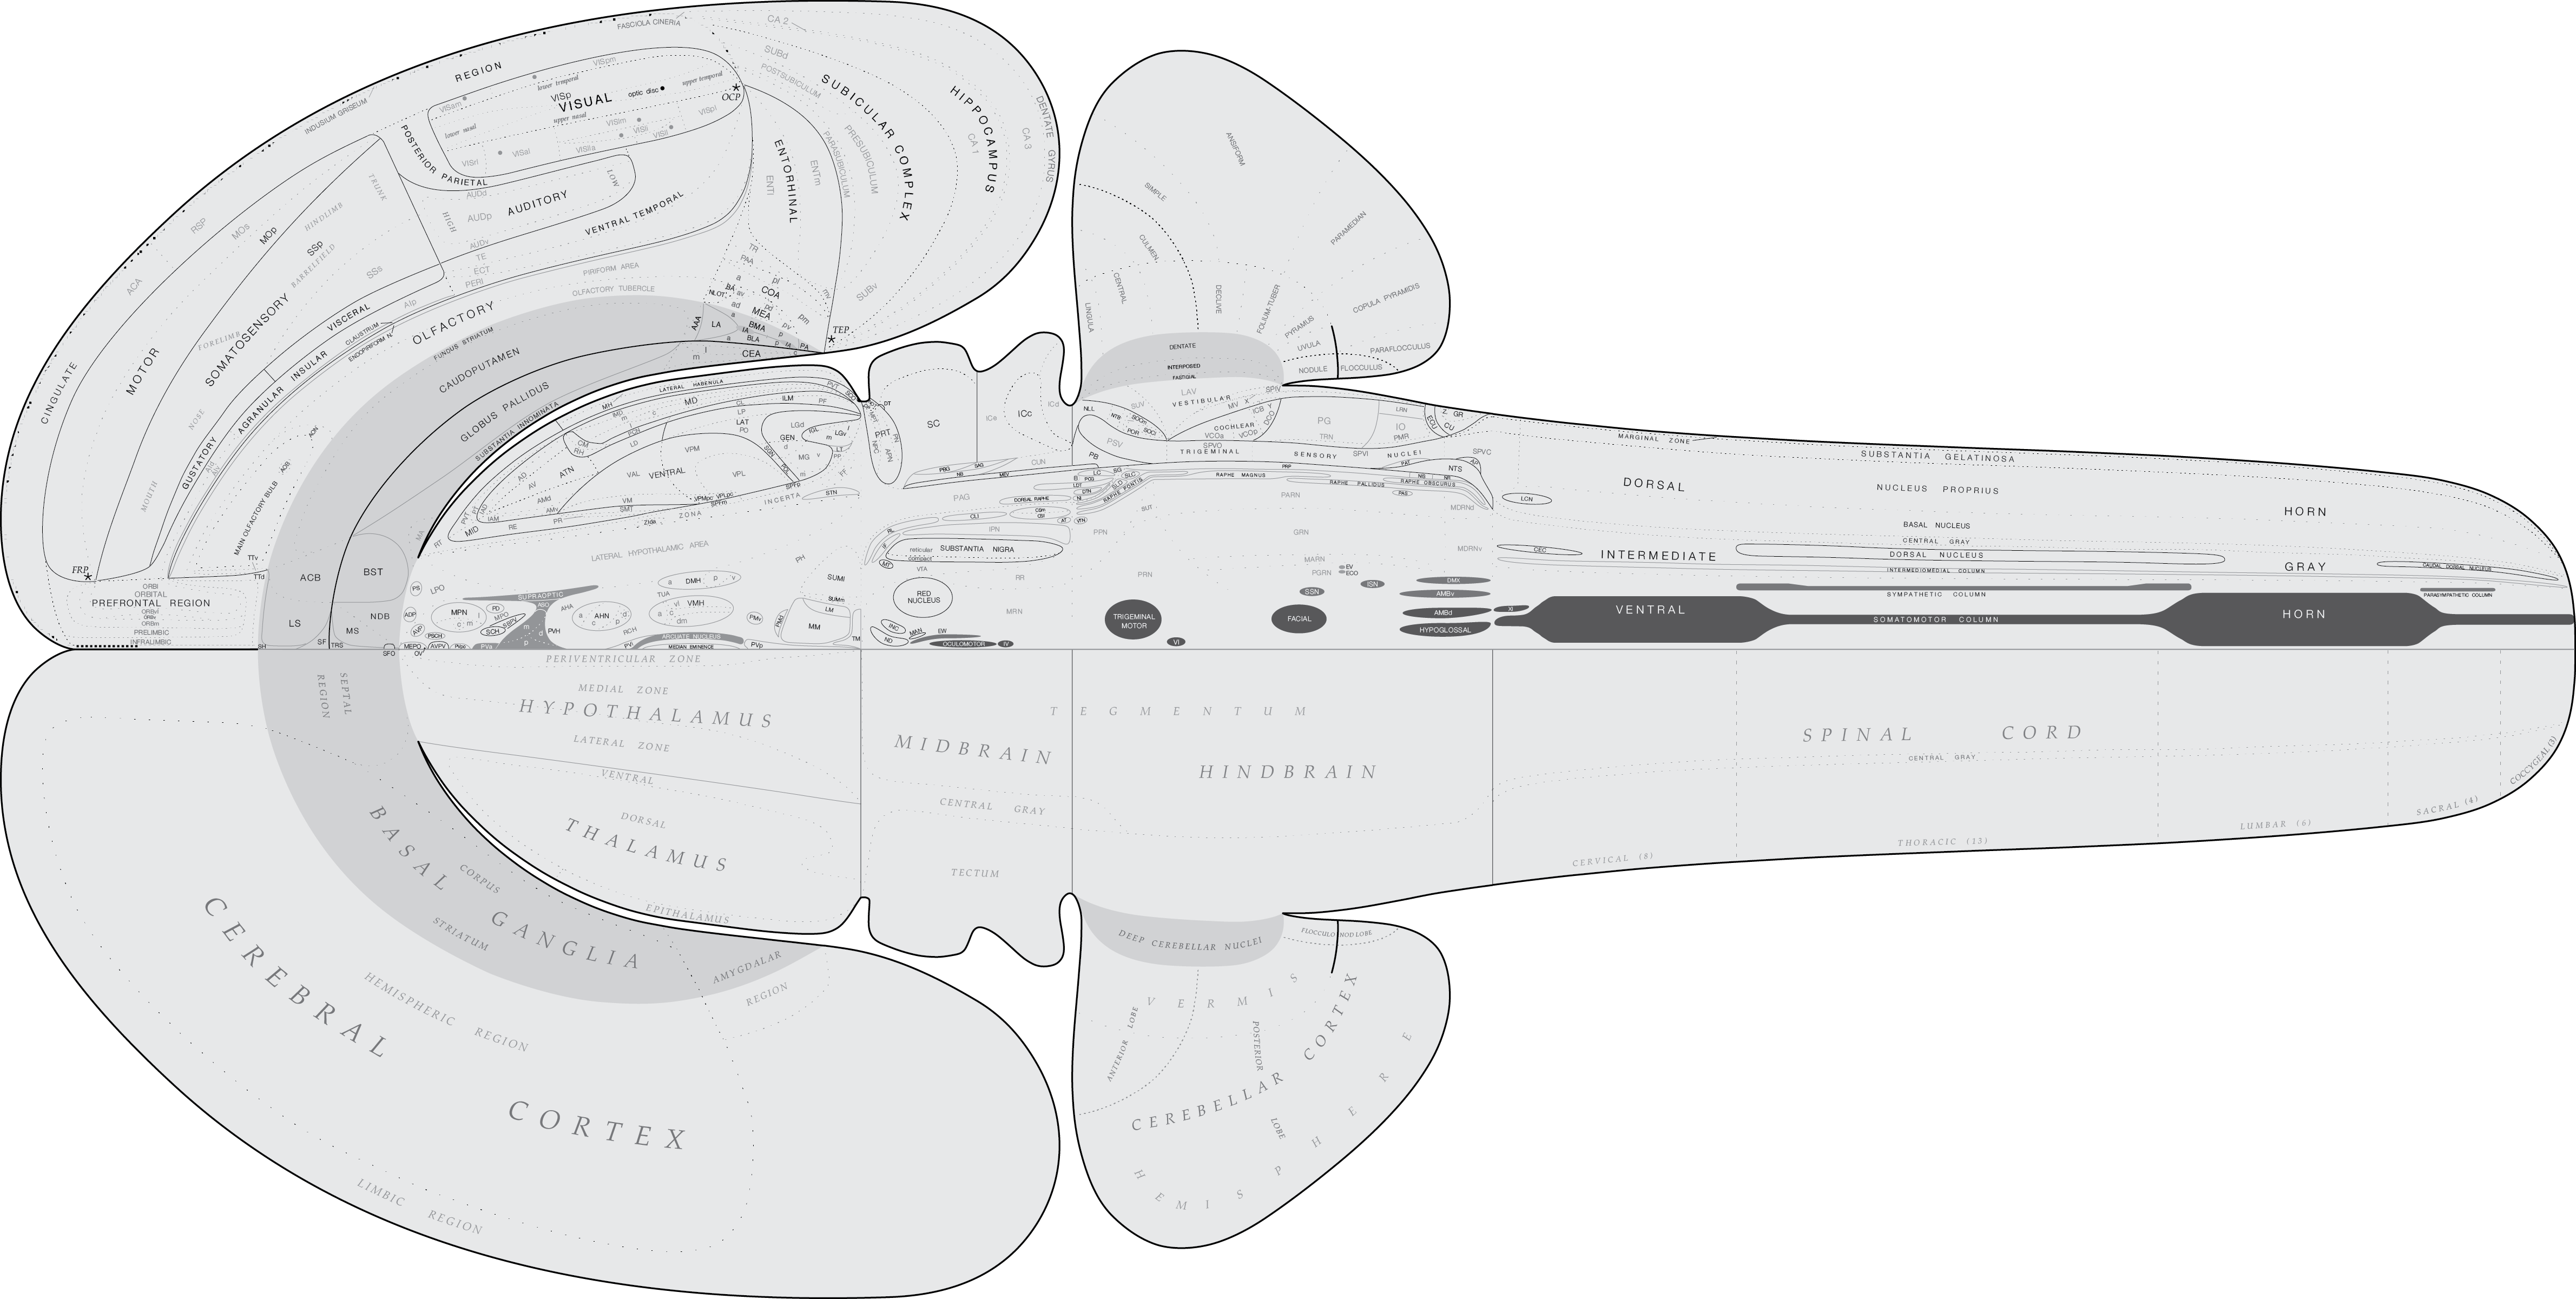 Bilateral flatmap of the rat central nervous system (Swanson, 1992).
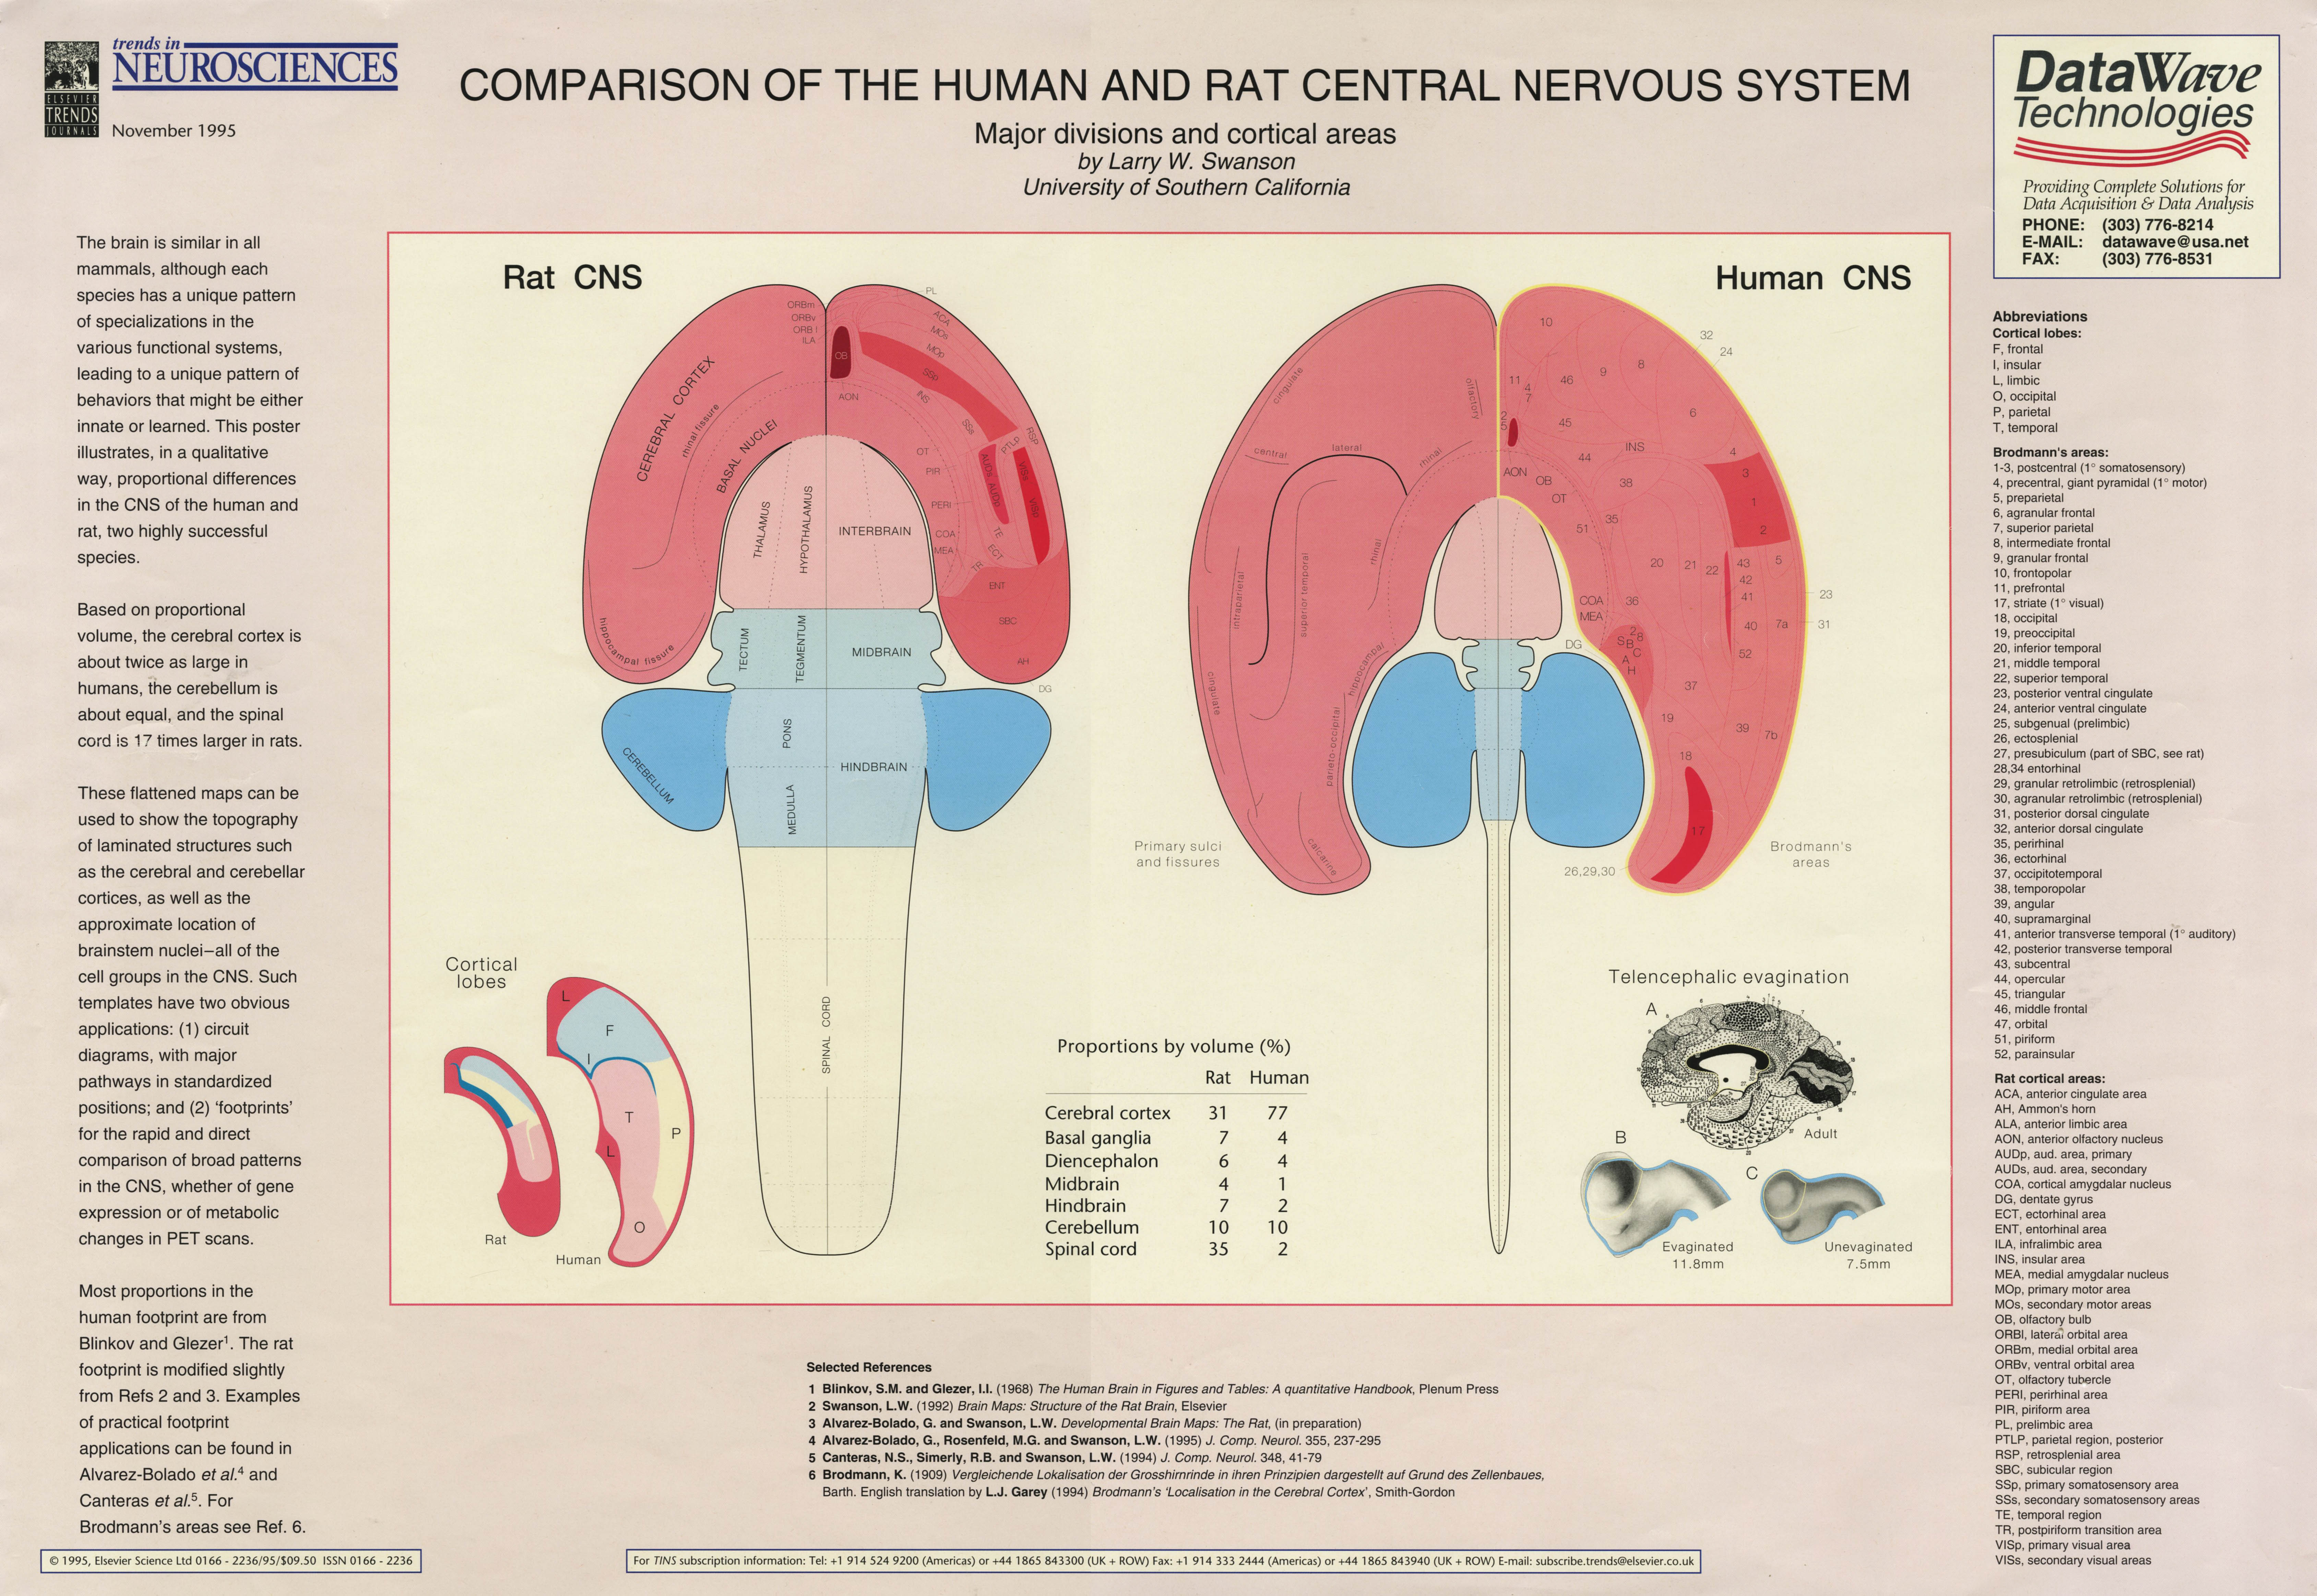 Comparison of rat and human central nervous system flatmaps. Poster by L.W. Swanson published in Trends in Neurosciences (November, 1995).
B. MAPPING CONNECTIONS AND CIRCUITRY ON FLATMAPS
Flatmaps are particularly useful for displaying the general organization of neural circuitry. Here are examples from Herrick (1948), Nauta & Karten (1970), Swanson & Hartman (1975), and Swanson (1993, 2004):
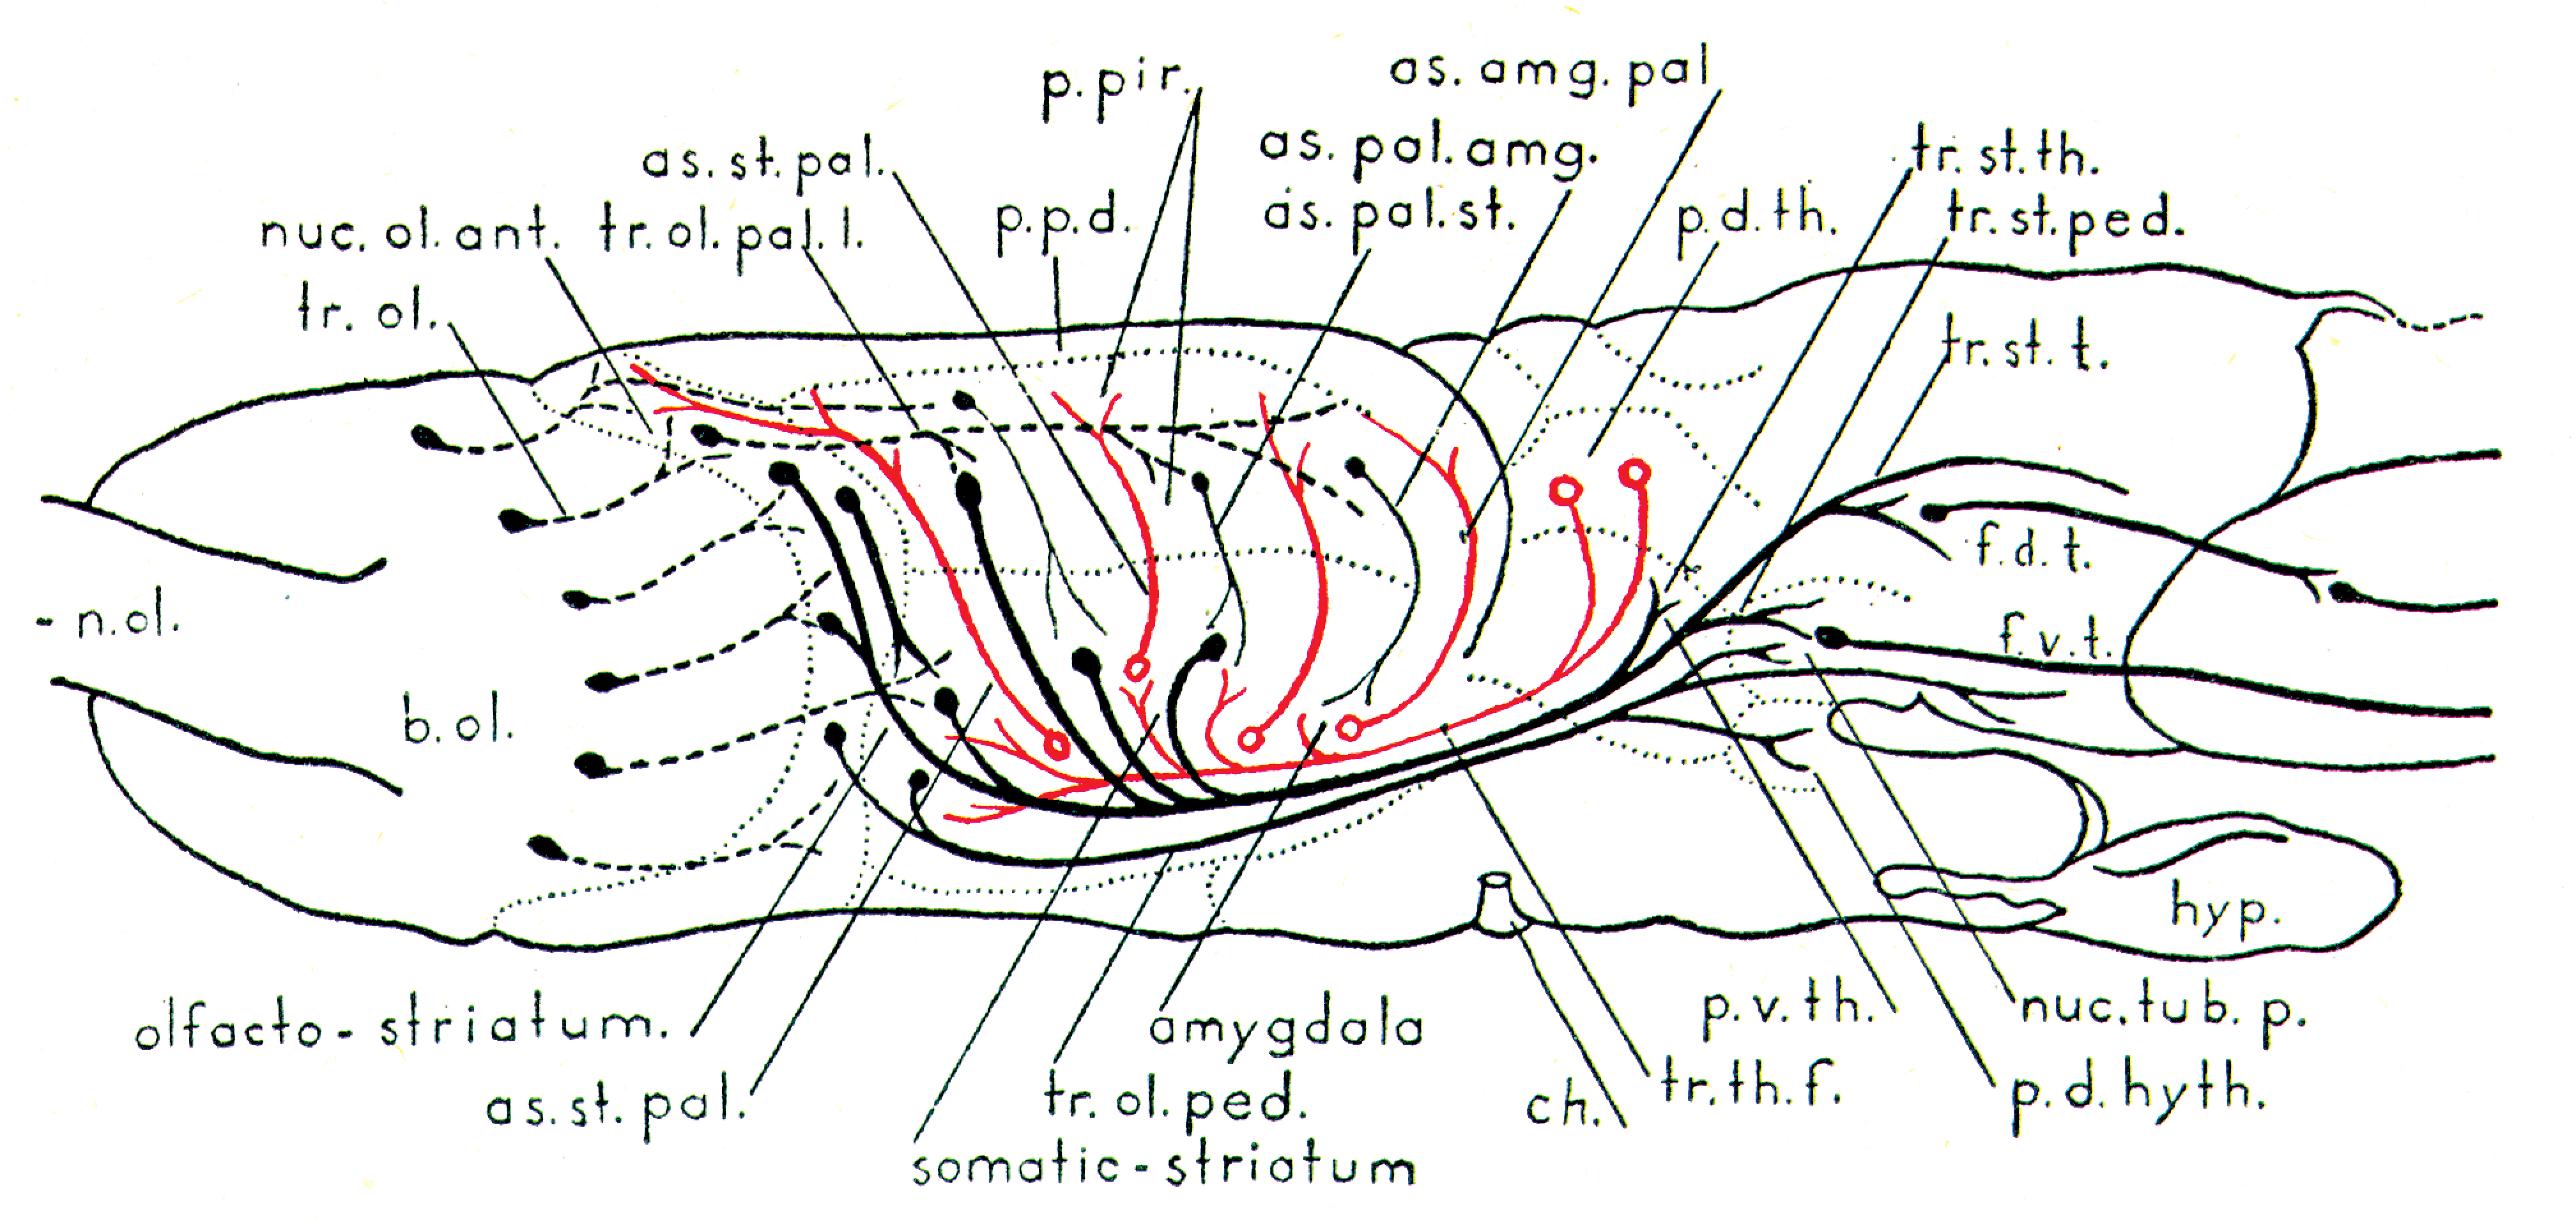 Some forebrain connections mapped on a flatmap of the amphibian, Necturus (Herrick, 1948).
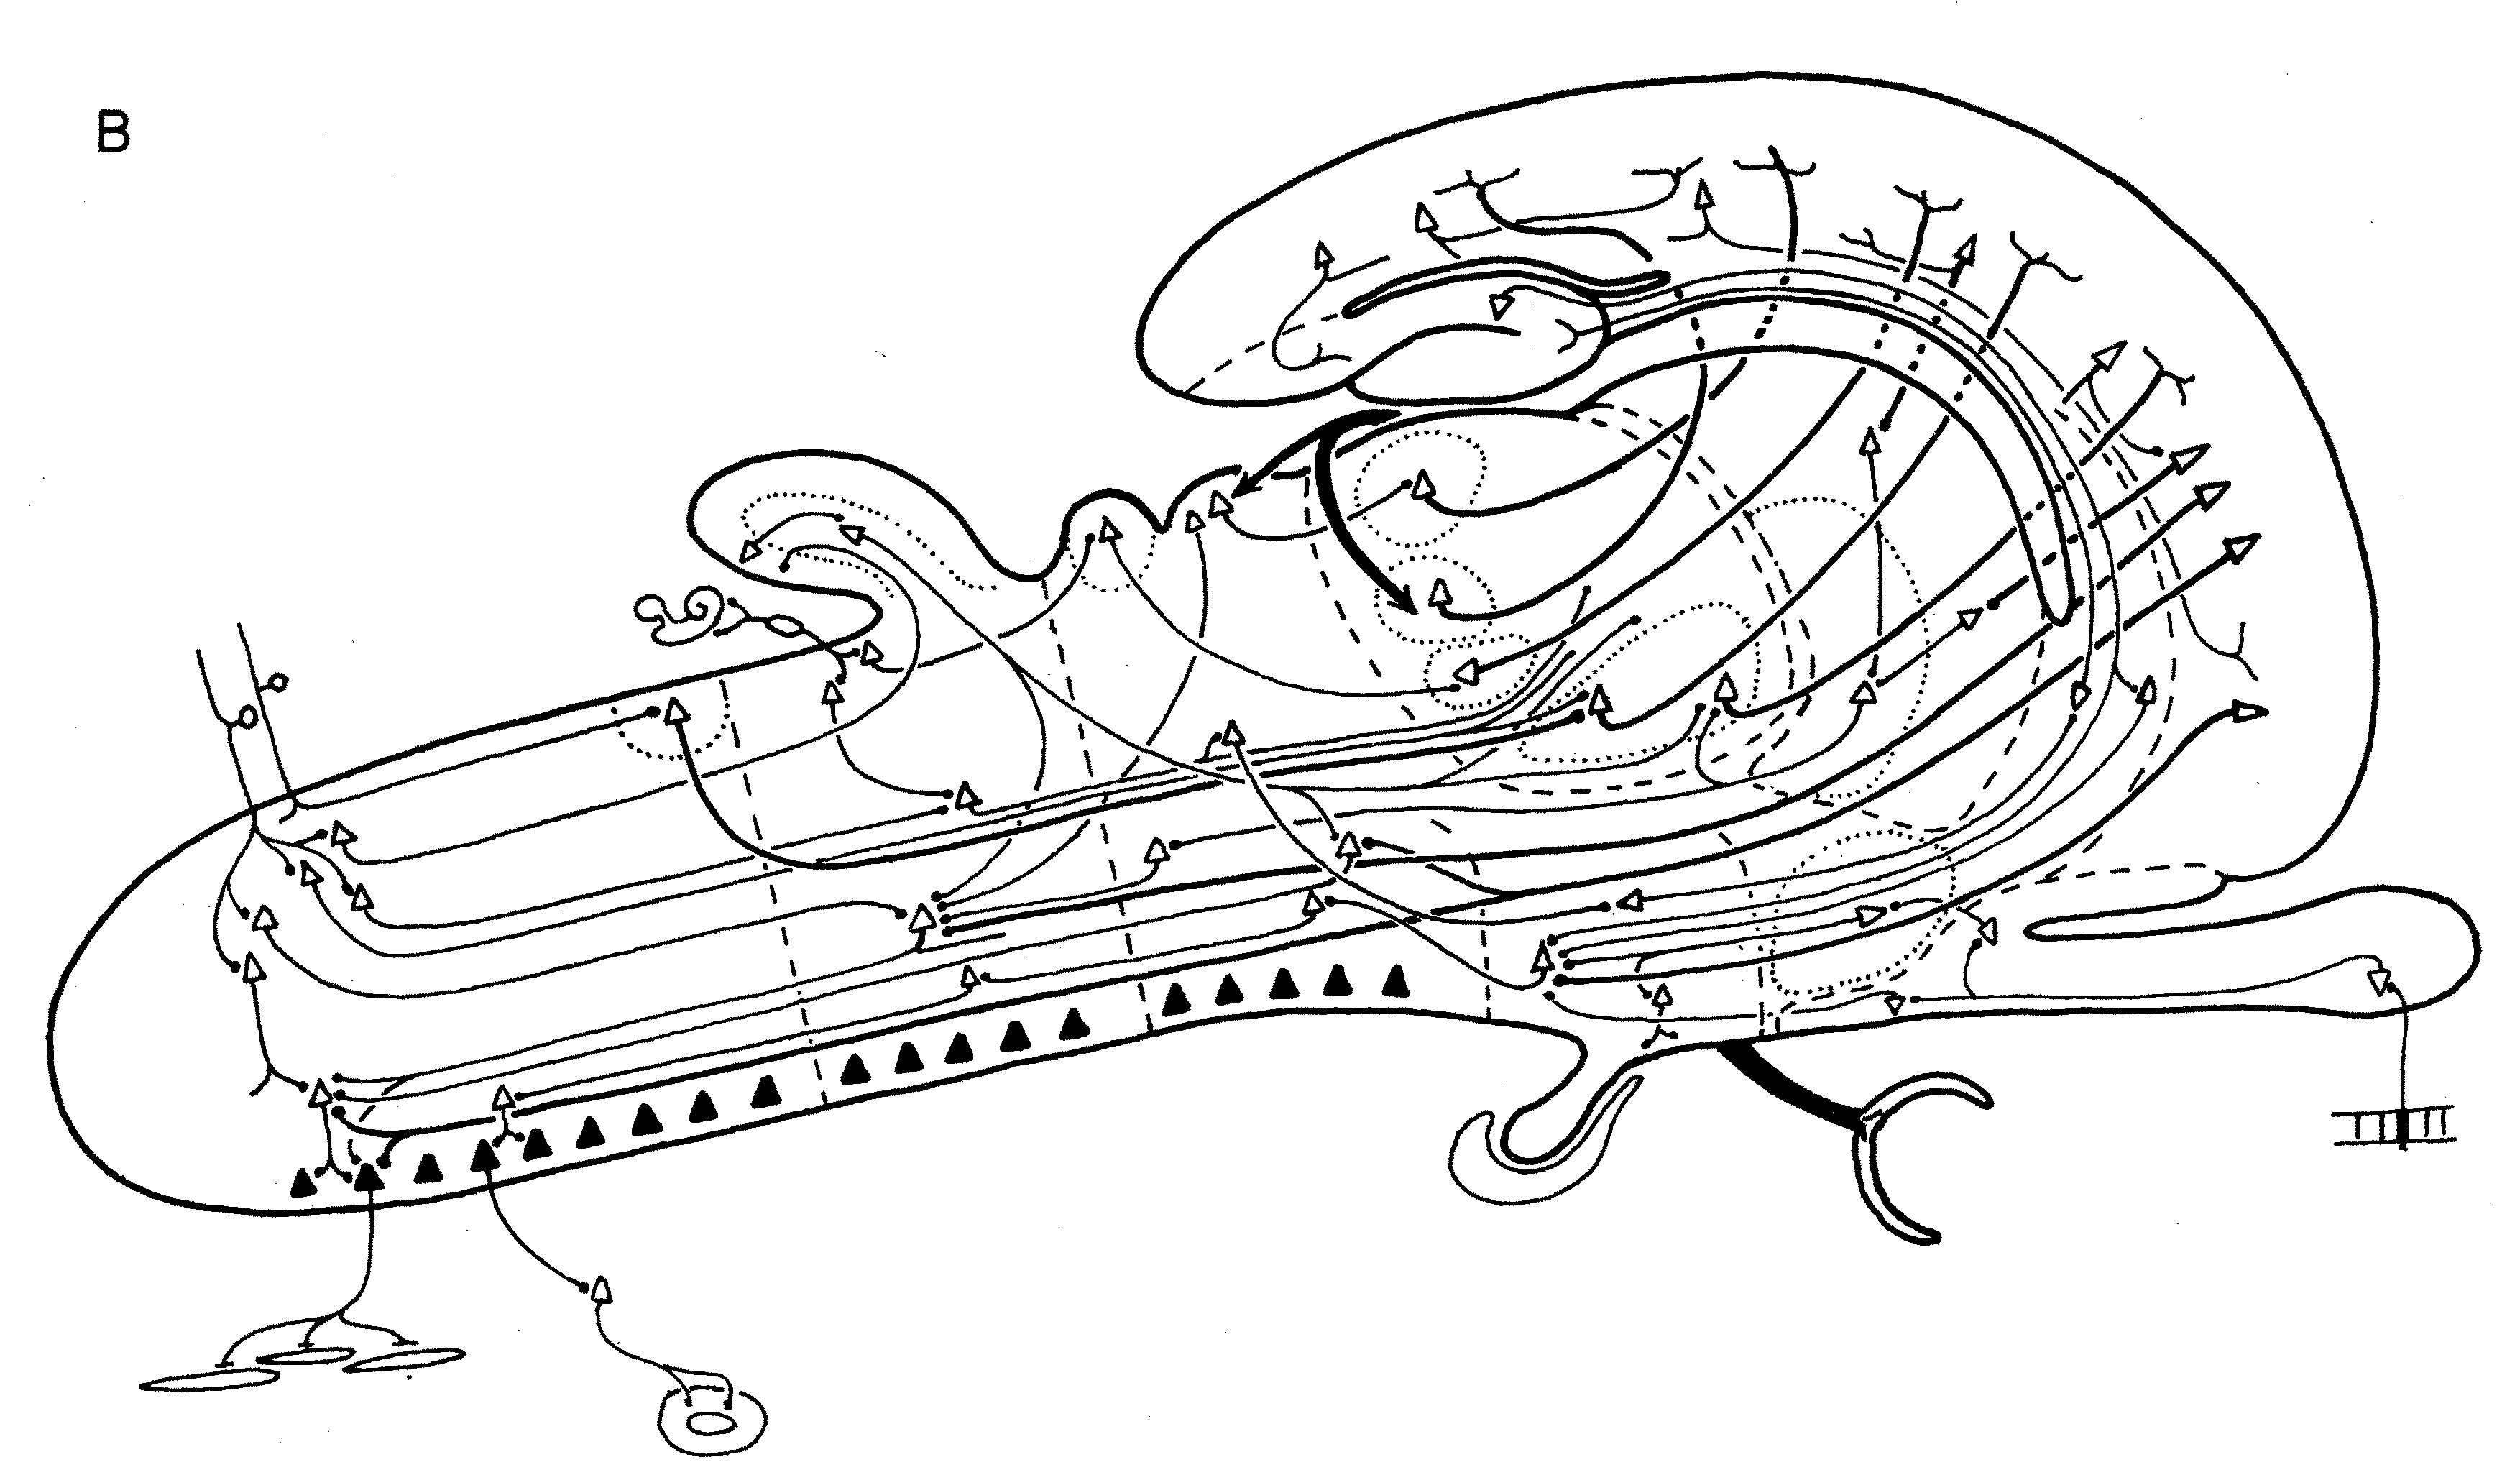 The general organization of sensory-motor pathways displayed on a flatmap of one side of the mammalian nervous system (Nauta & Karten, 1970).
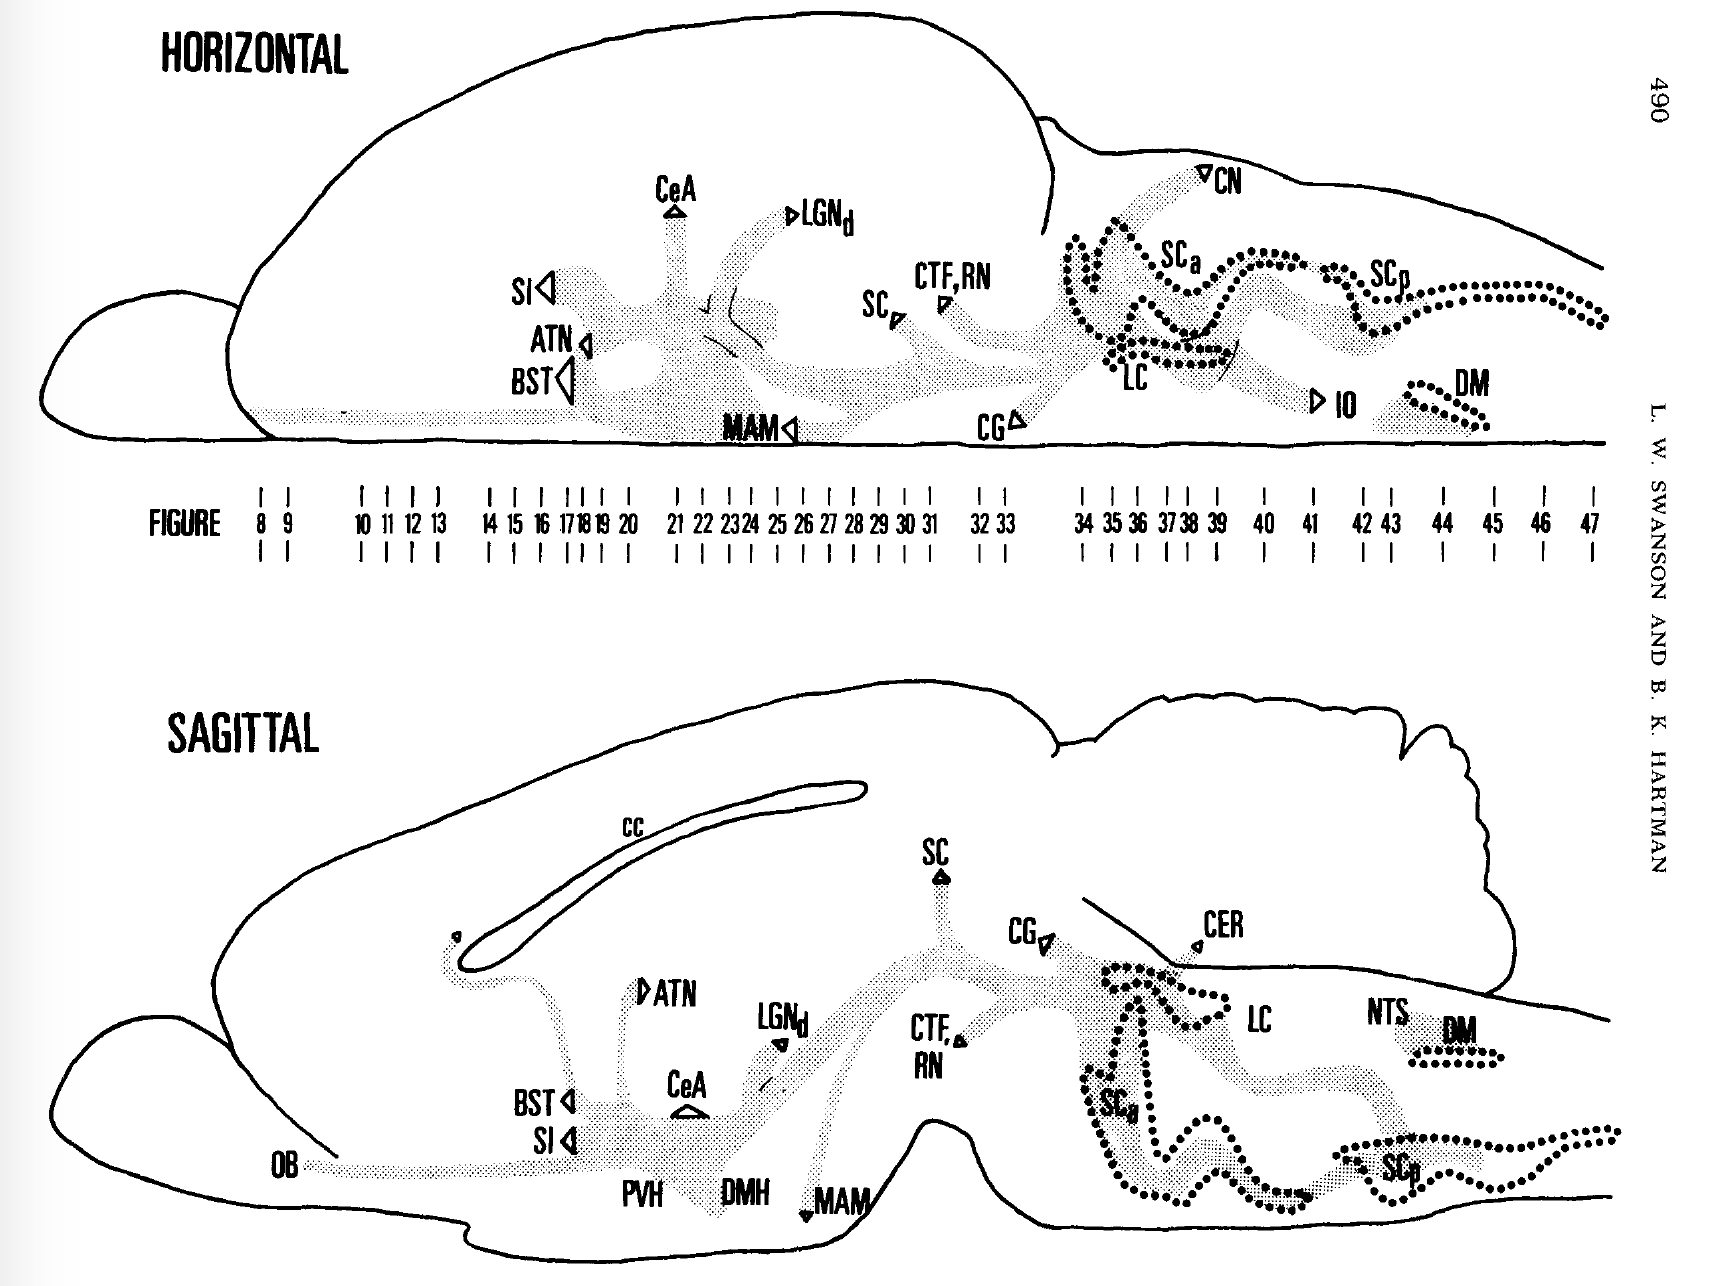
Overall organization of the central adrenergic/noradrenergic system in the rat brain mapped with an antiserum to to the synthetic enzyme dopamine beta-hydroxylase (regions of neuronal cell bodies outlined with dots with major pathways shaded in gray). From Swanson & Hartman (1975).
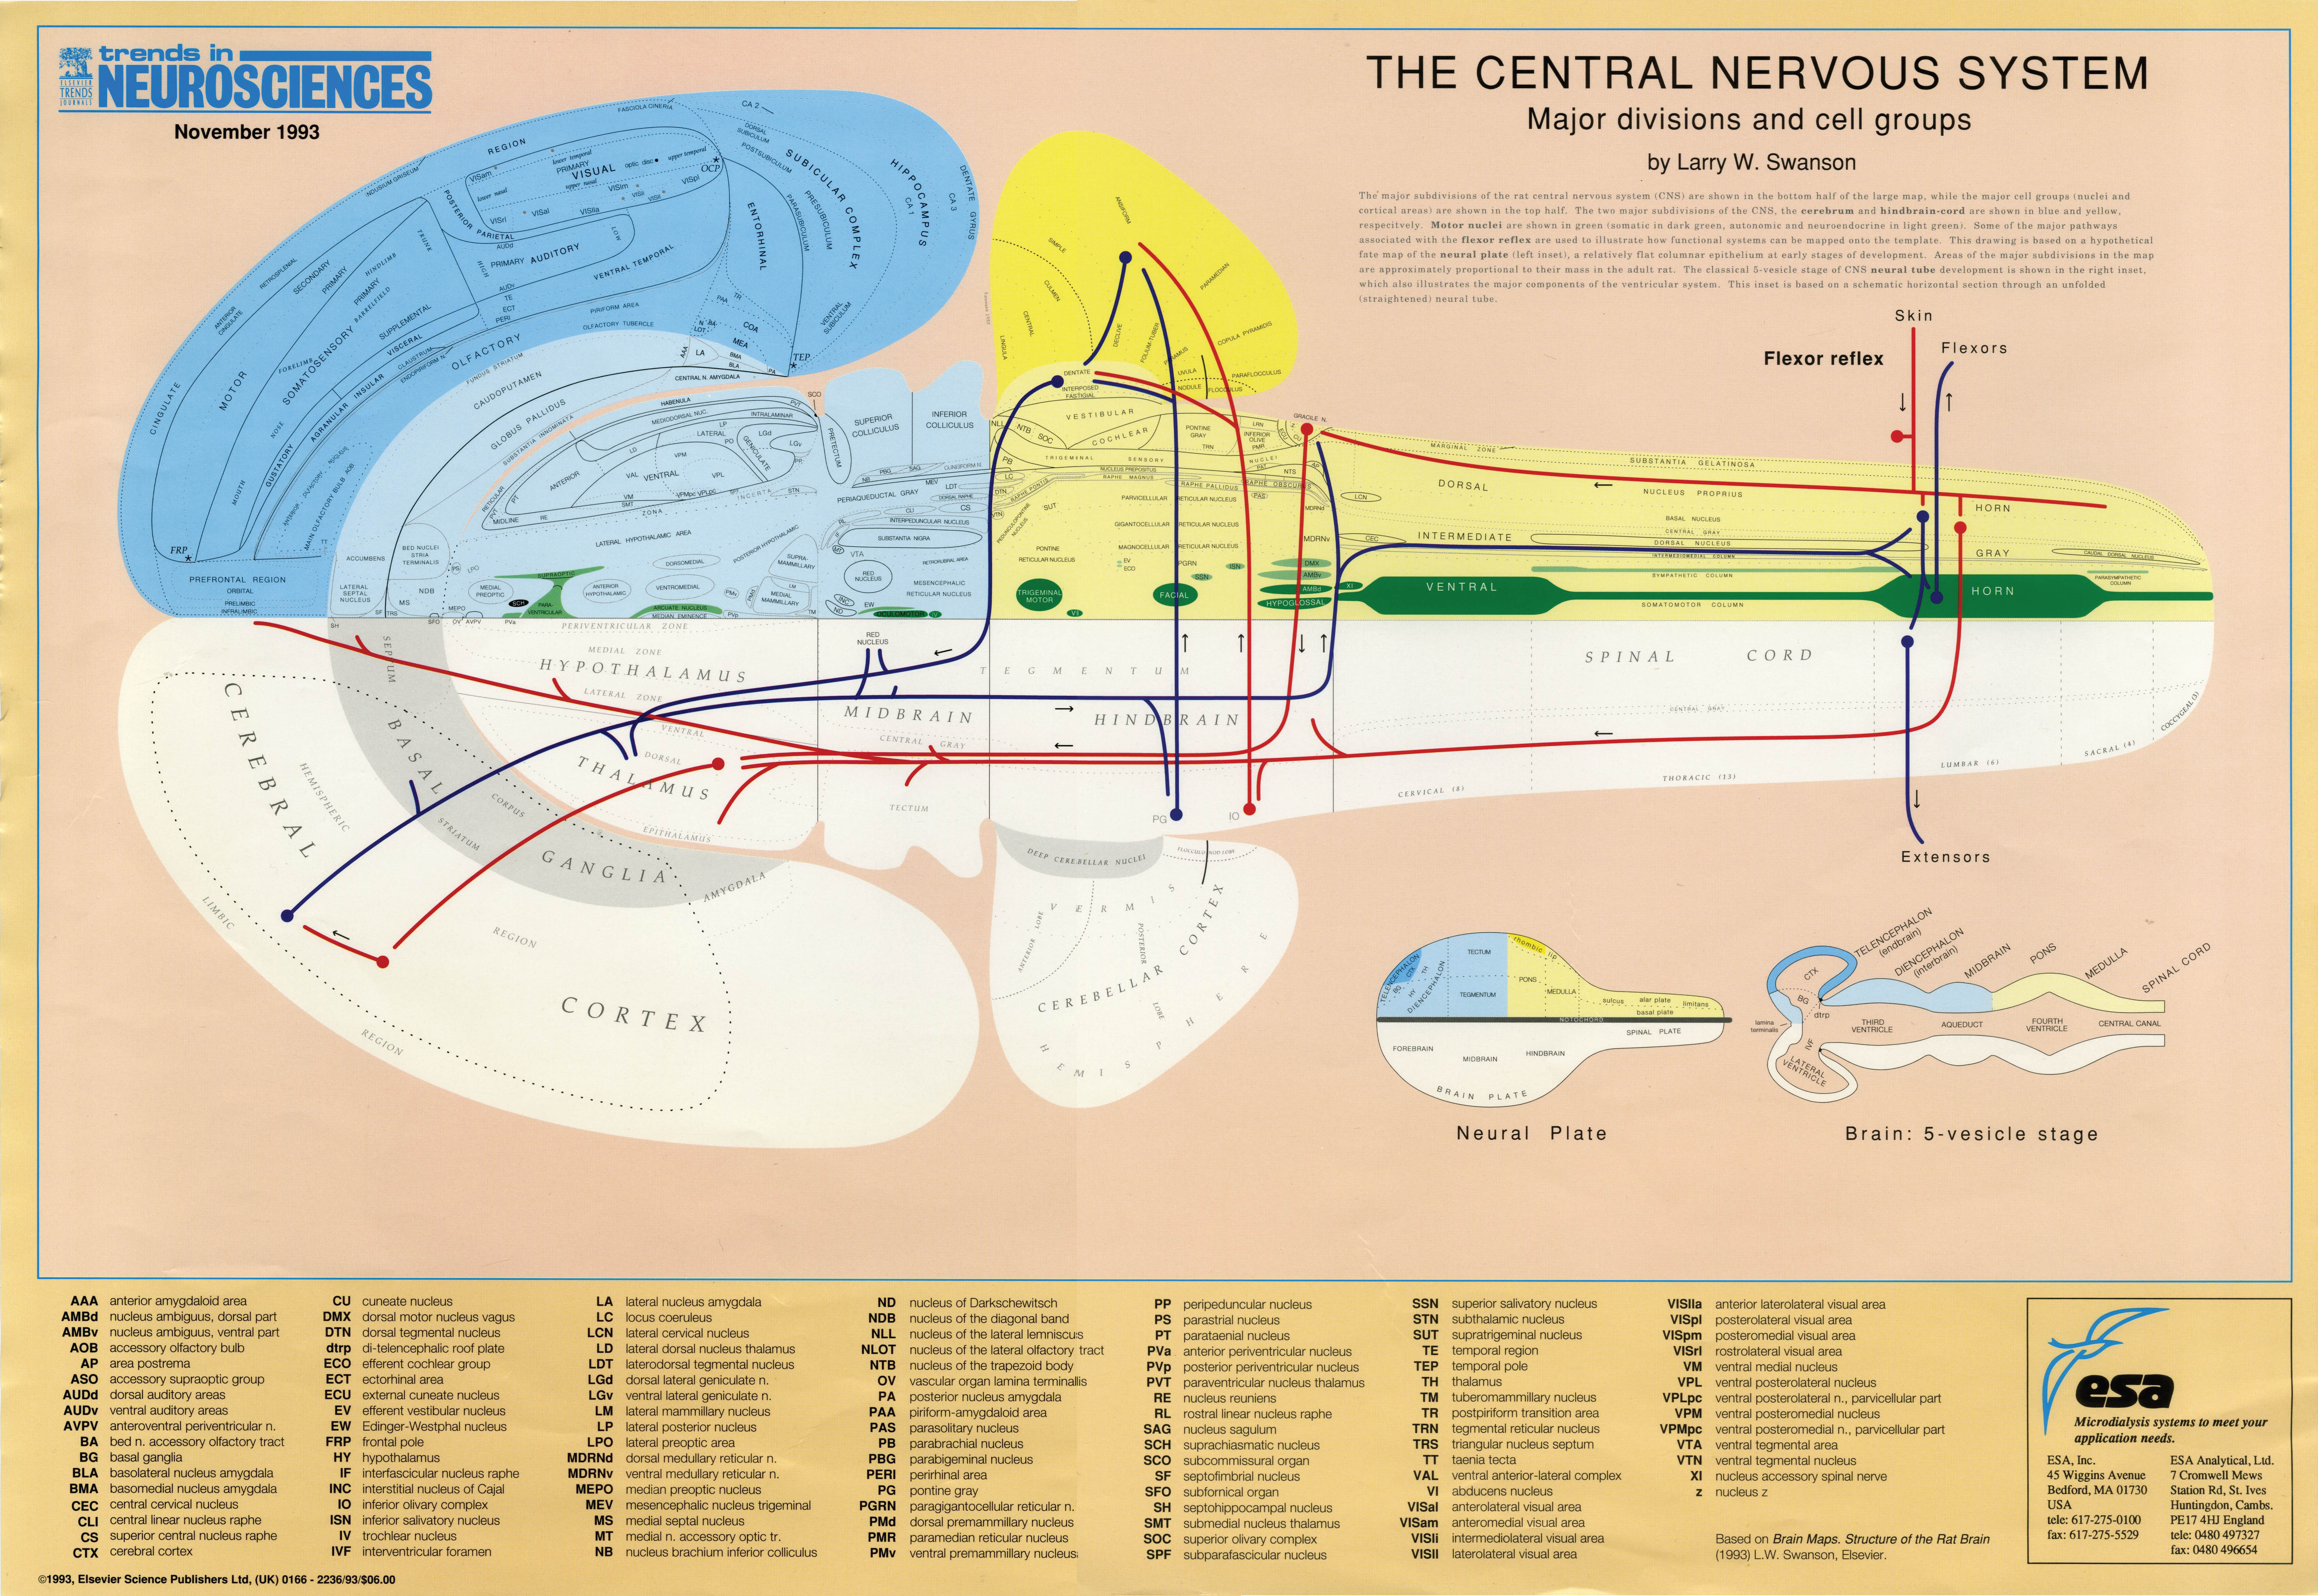 Circuitry associated with the flexor reflex displayed on a flatmap of the rat central nervous system. Poster by L.W. Swanson published in Trends in Neurosciences (November, 1993).
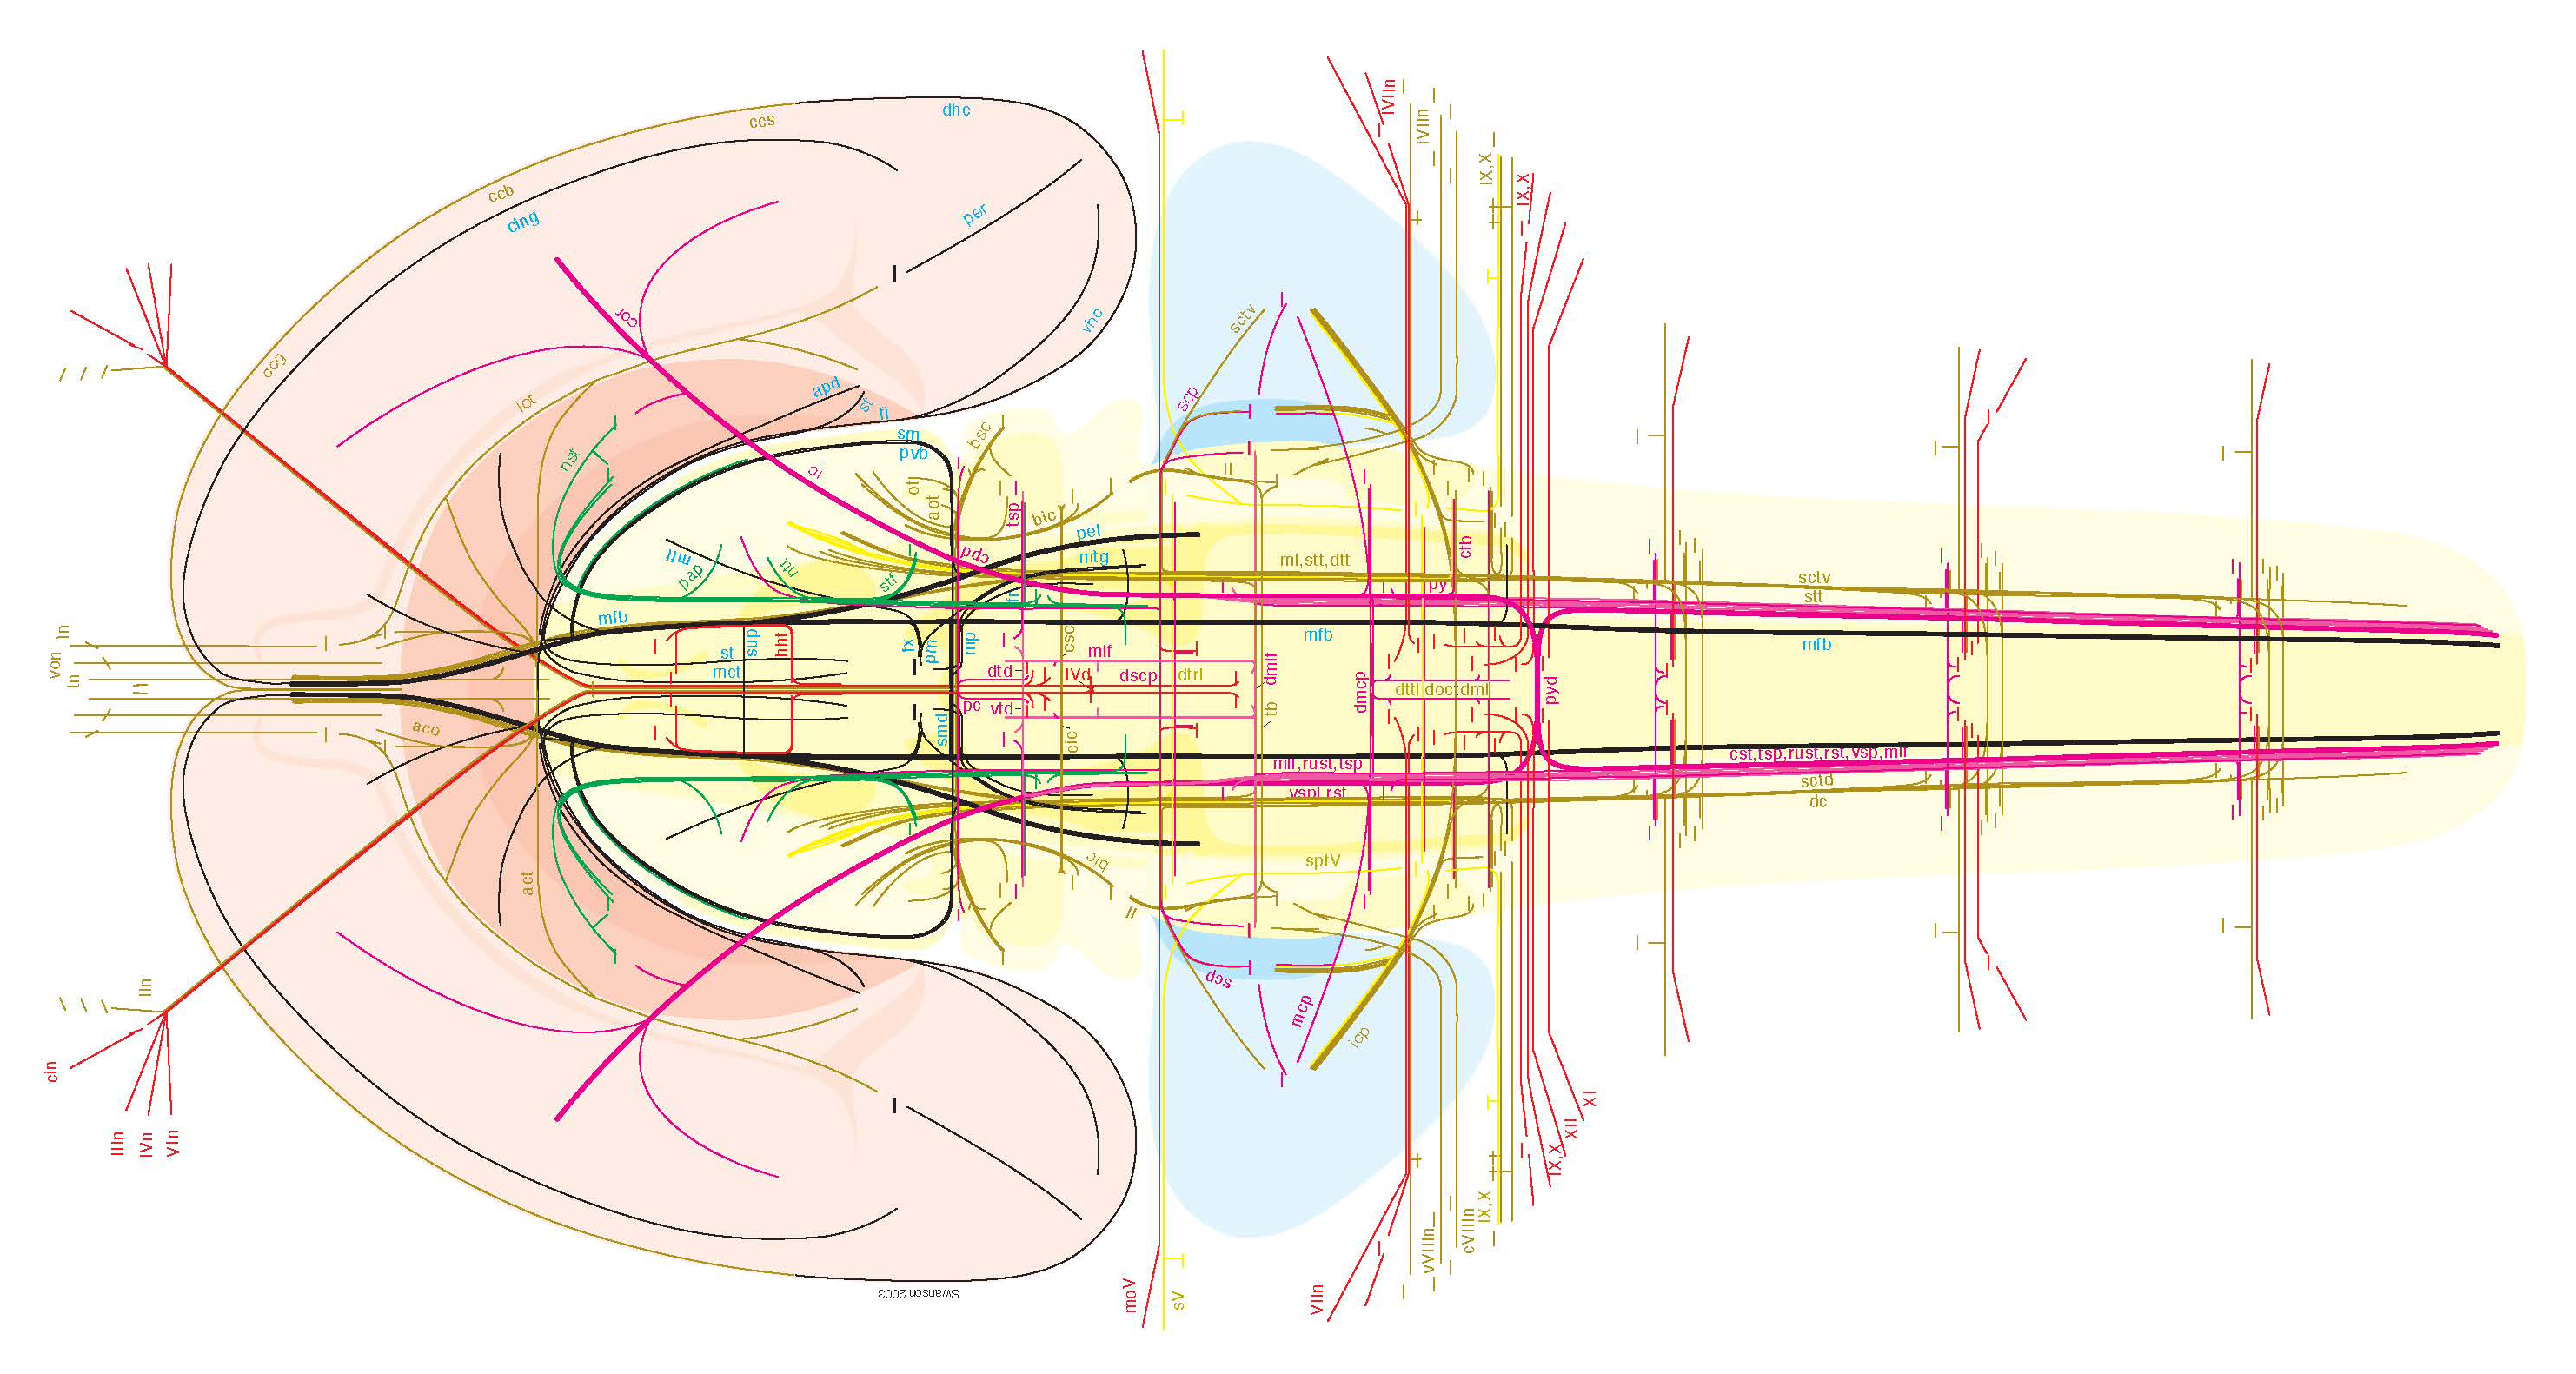 All of the major white matter tracts shown on a flatmap of the rat central nervous system (Swanson, 2004).
C. CONSTRUCTING THE SWANSON FLATMAPS
The starting point for this project was a flattening of the rat hippocampal formation to show the topological relationships of intrahippocampal connections (). For this, a color-coded 3D model of the rat hippocampal formation was constructed with foam rubber from enlargements of histological sections. The surface of the model (representing the main cell layers) was covered with Plastic Wrap, the location of sections was drawn on with an indelible pen, and then the surface drawings were stretched out on a flat surface and connected to produce the flatmap.
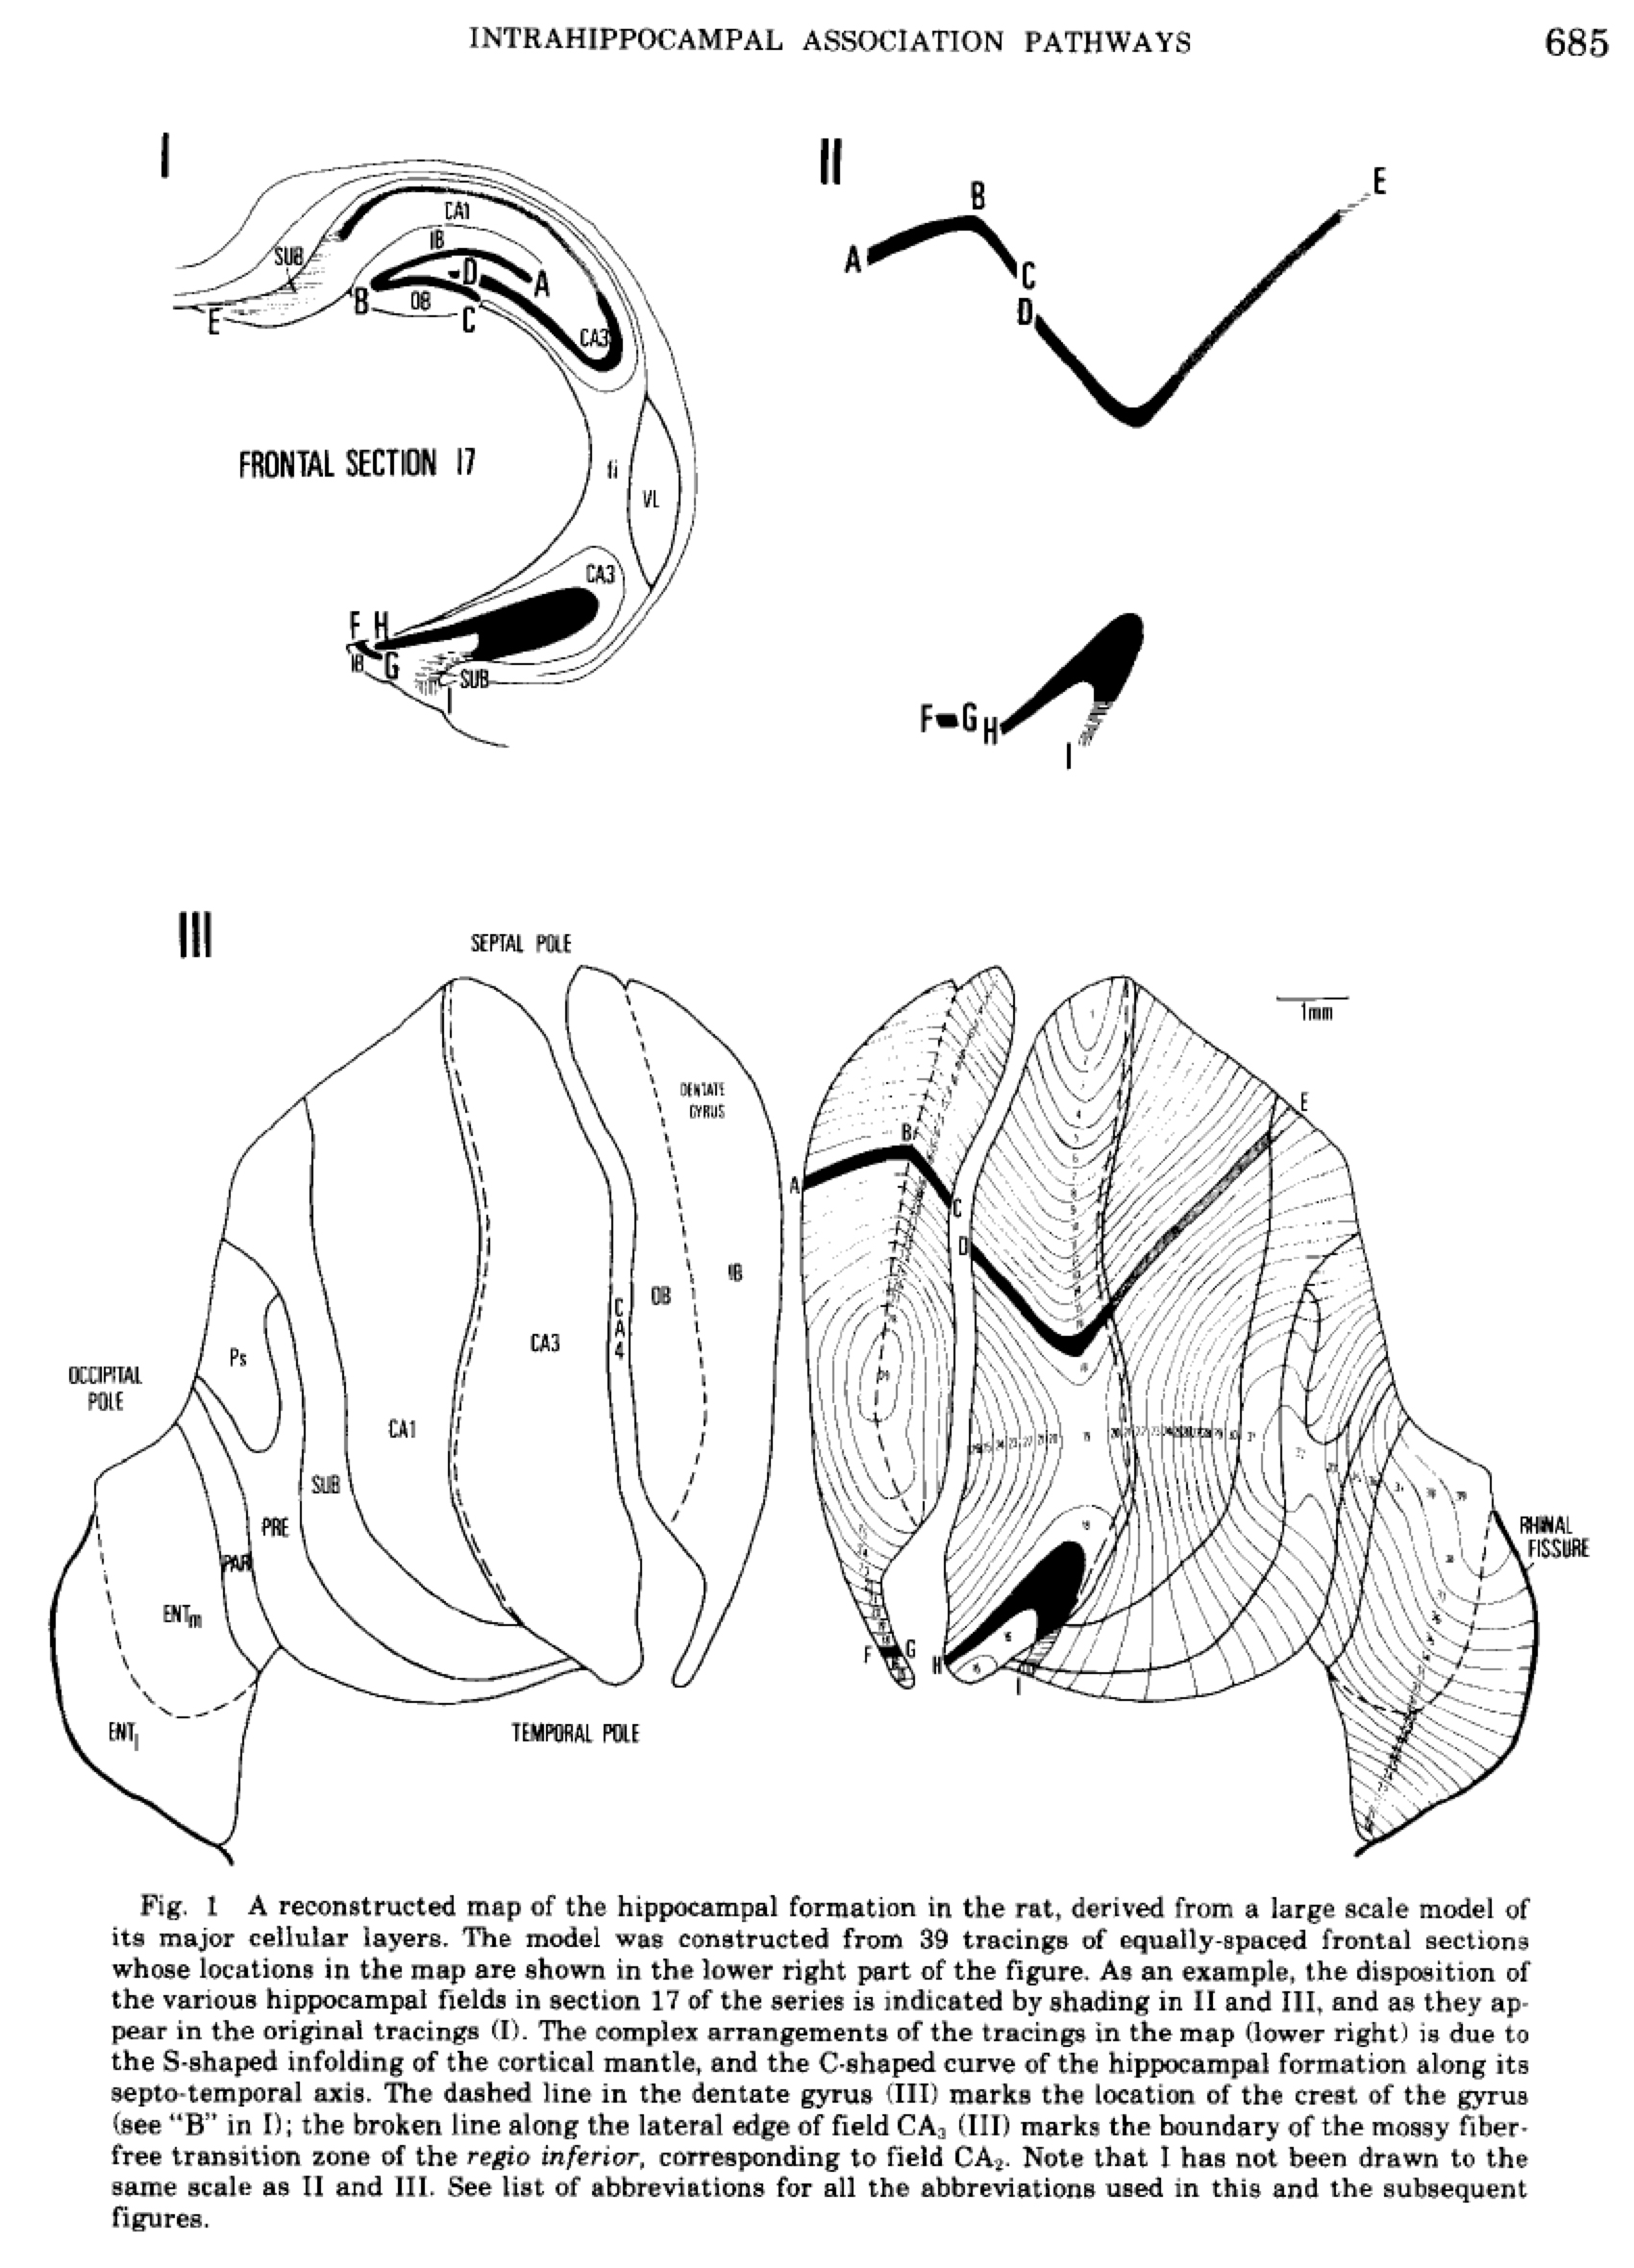 Rat hippocampal flatmap (Swanson, Wyss, & Cowan, 1978).
This was a good starting point for flattening the whole cortical mantle in the rat, which was accomplished later. In the meantime, an immediate precursor of the 1992 flatmap was created to illustrate the output connections of the medial preoptic nucleus demonstrated with the PHAL anterograde pathway tracing method (Simerly & Swanson, 1988). This flatmap was useful for showing the organization of pathways and terminal fields arising in the medial preoptic nucleus, but it was not systematic in the sense of including all parts of the brain, and the spinal cord was not represented:
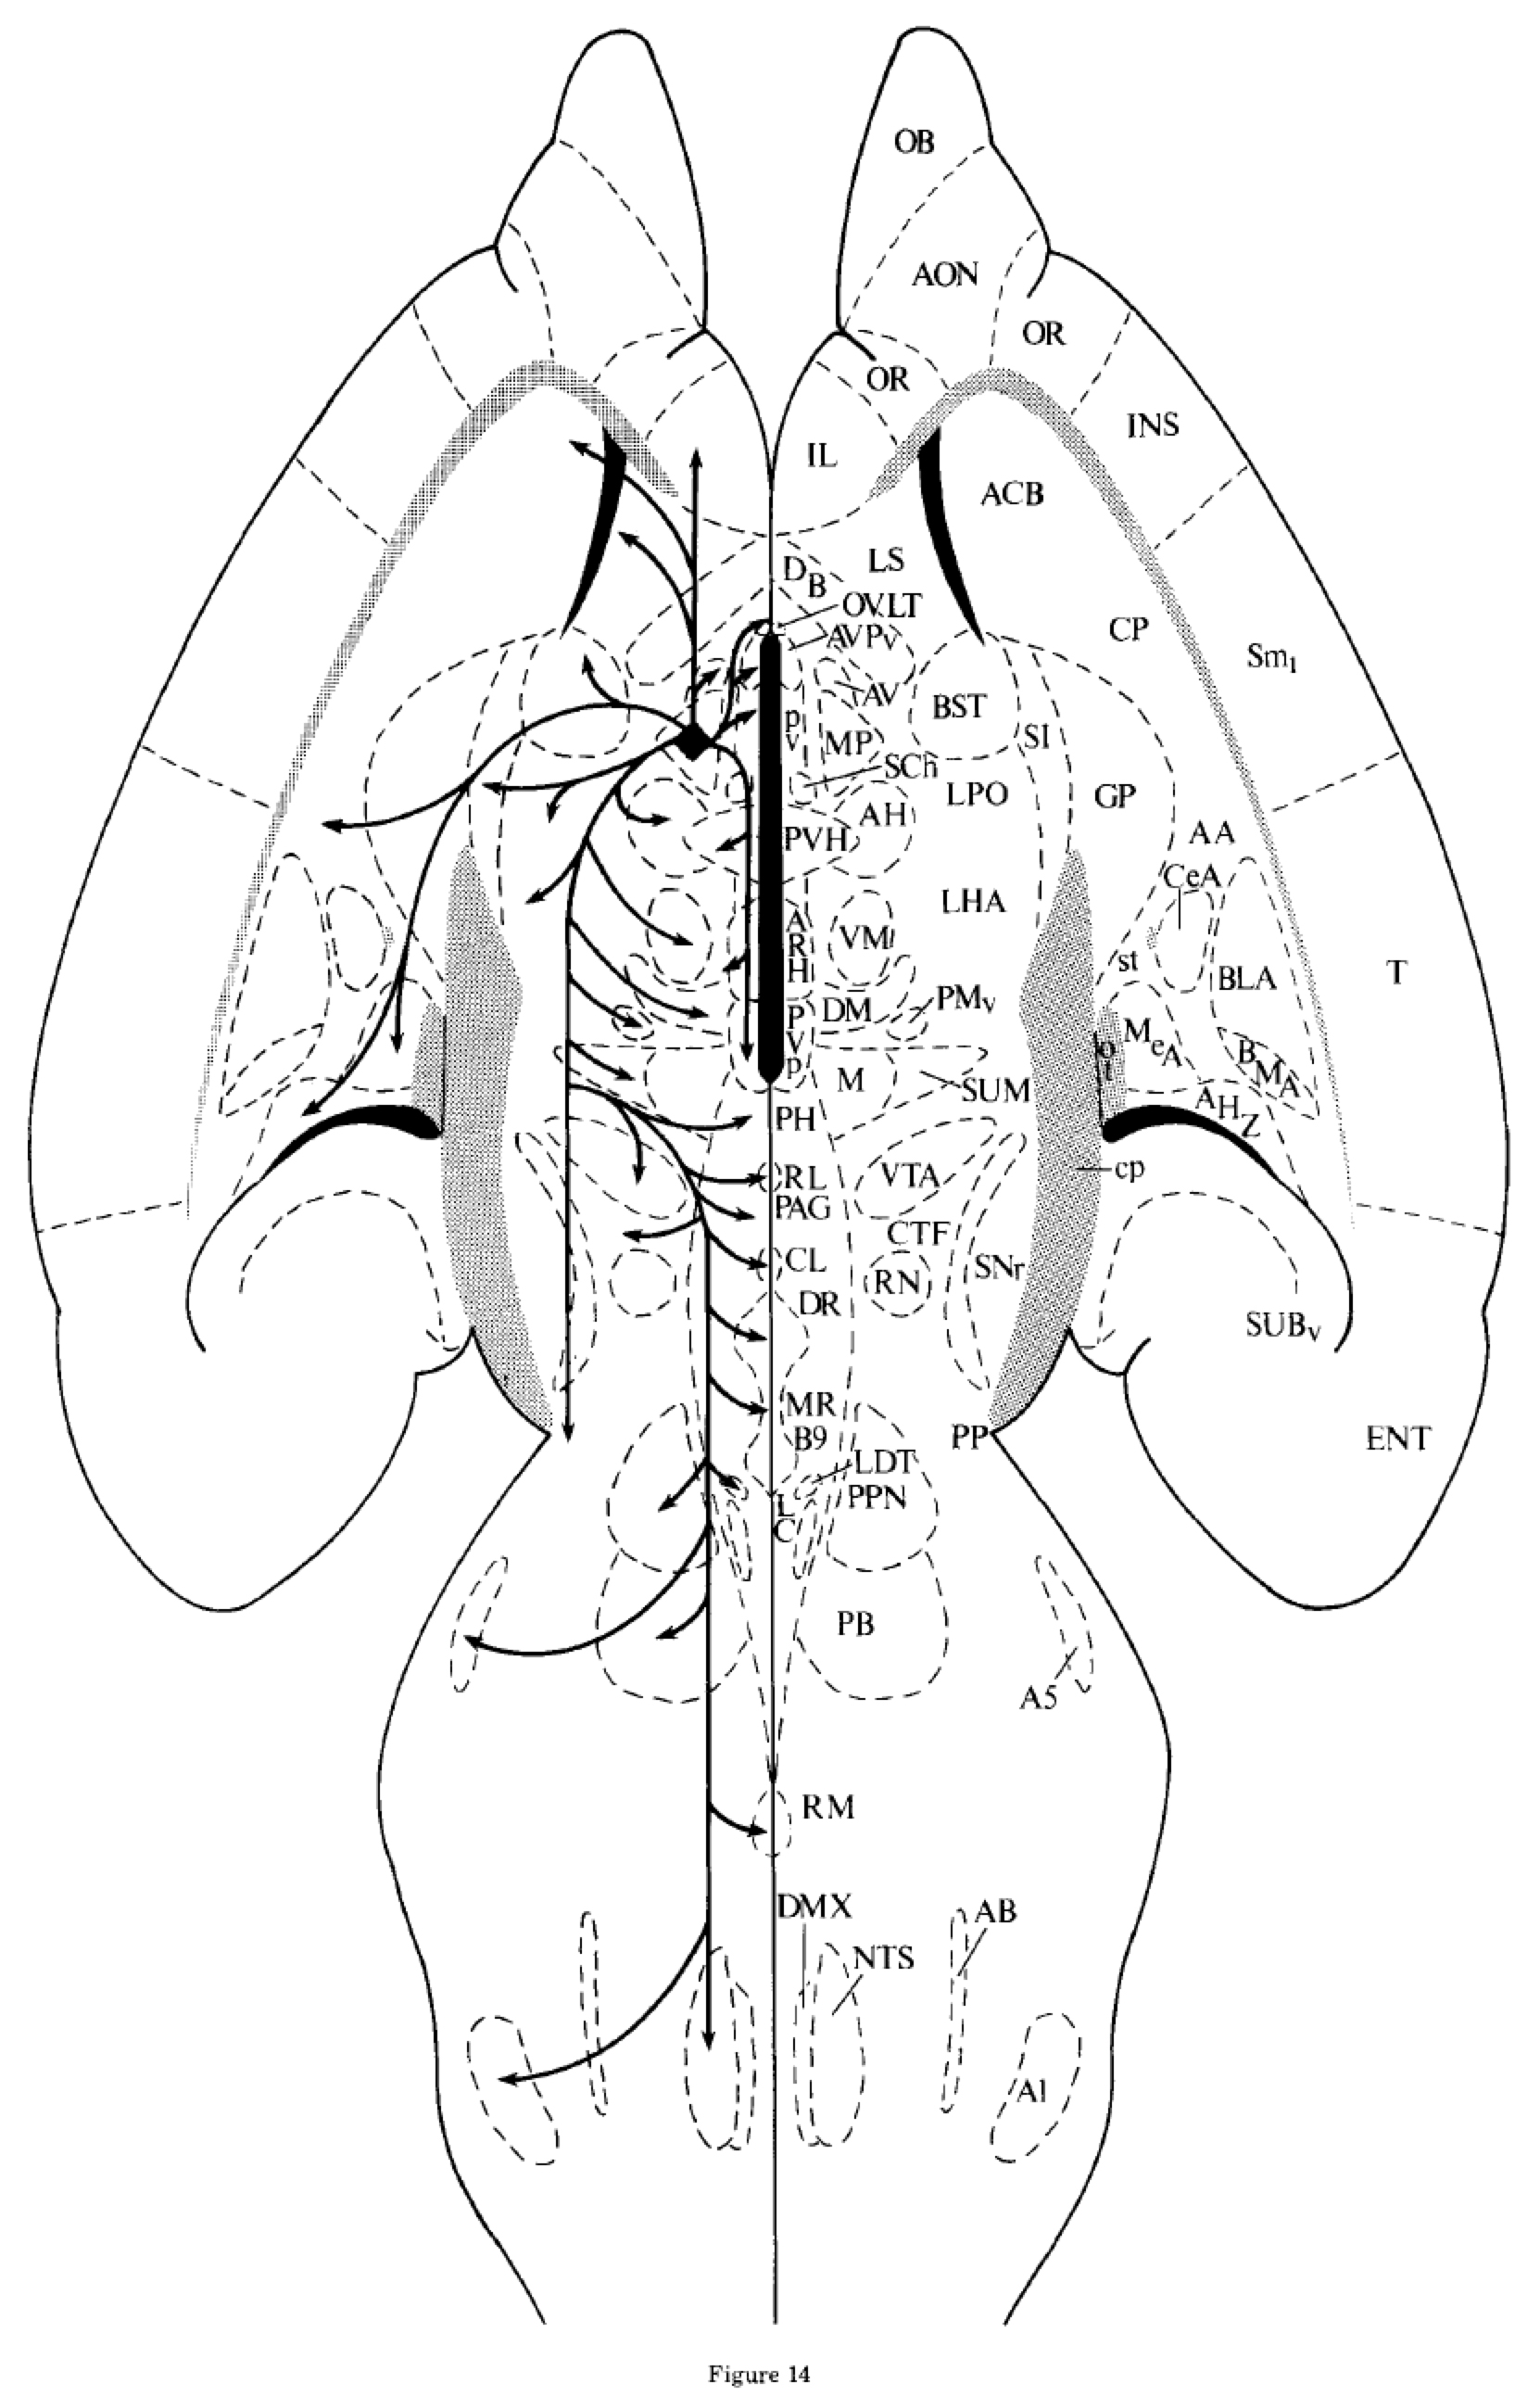 Flatmap showing output connections (pathways and terminal fields) of the rat medial preoptic nucleus (Simerly & Swanson, 1988).
As mentioned above, the 1992 Swanson flatmap of the rat central nervous system was based on embryological principles and in essence is a “best guess” fate map of the neural plate:
 Fatemap of the mammalian (vertebrate) neural plate (Swanson, 2012). Abbreviations: C, caudal; R, rostral.
Approaches and conventions for constructing the Swanson 1992 flatmap may be found in Swanson (1992) and Alvarez-Bolado & Swanson (1996). In addition, a systematic way of creating flatmaps at various stages of embryonic development was worked out (Alvarez-Bolado et al., 1995), and it was used to construct a series of flatmaps from the neural plate stage to the adult central nervous system:
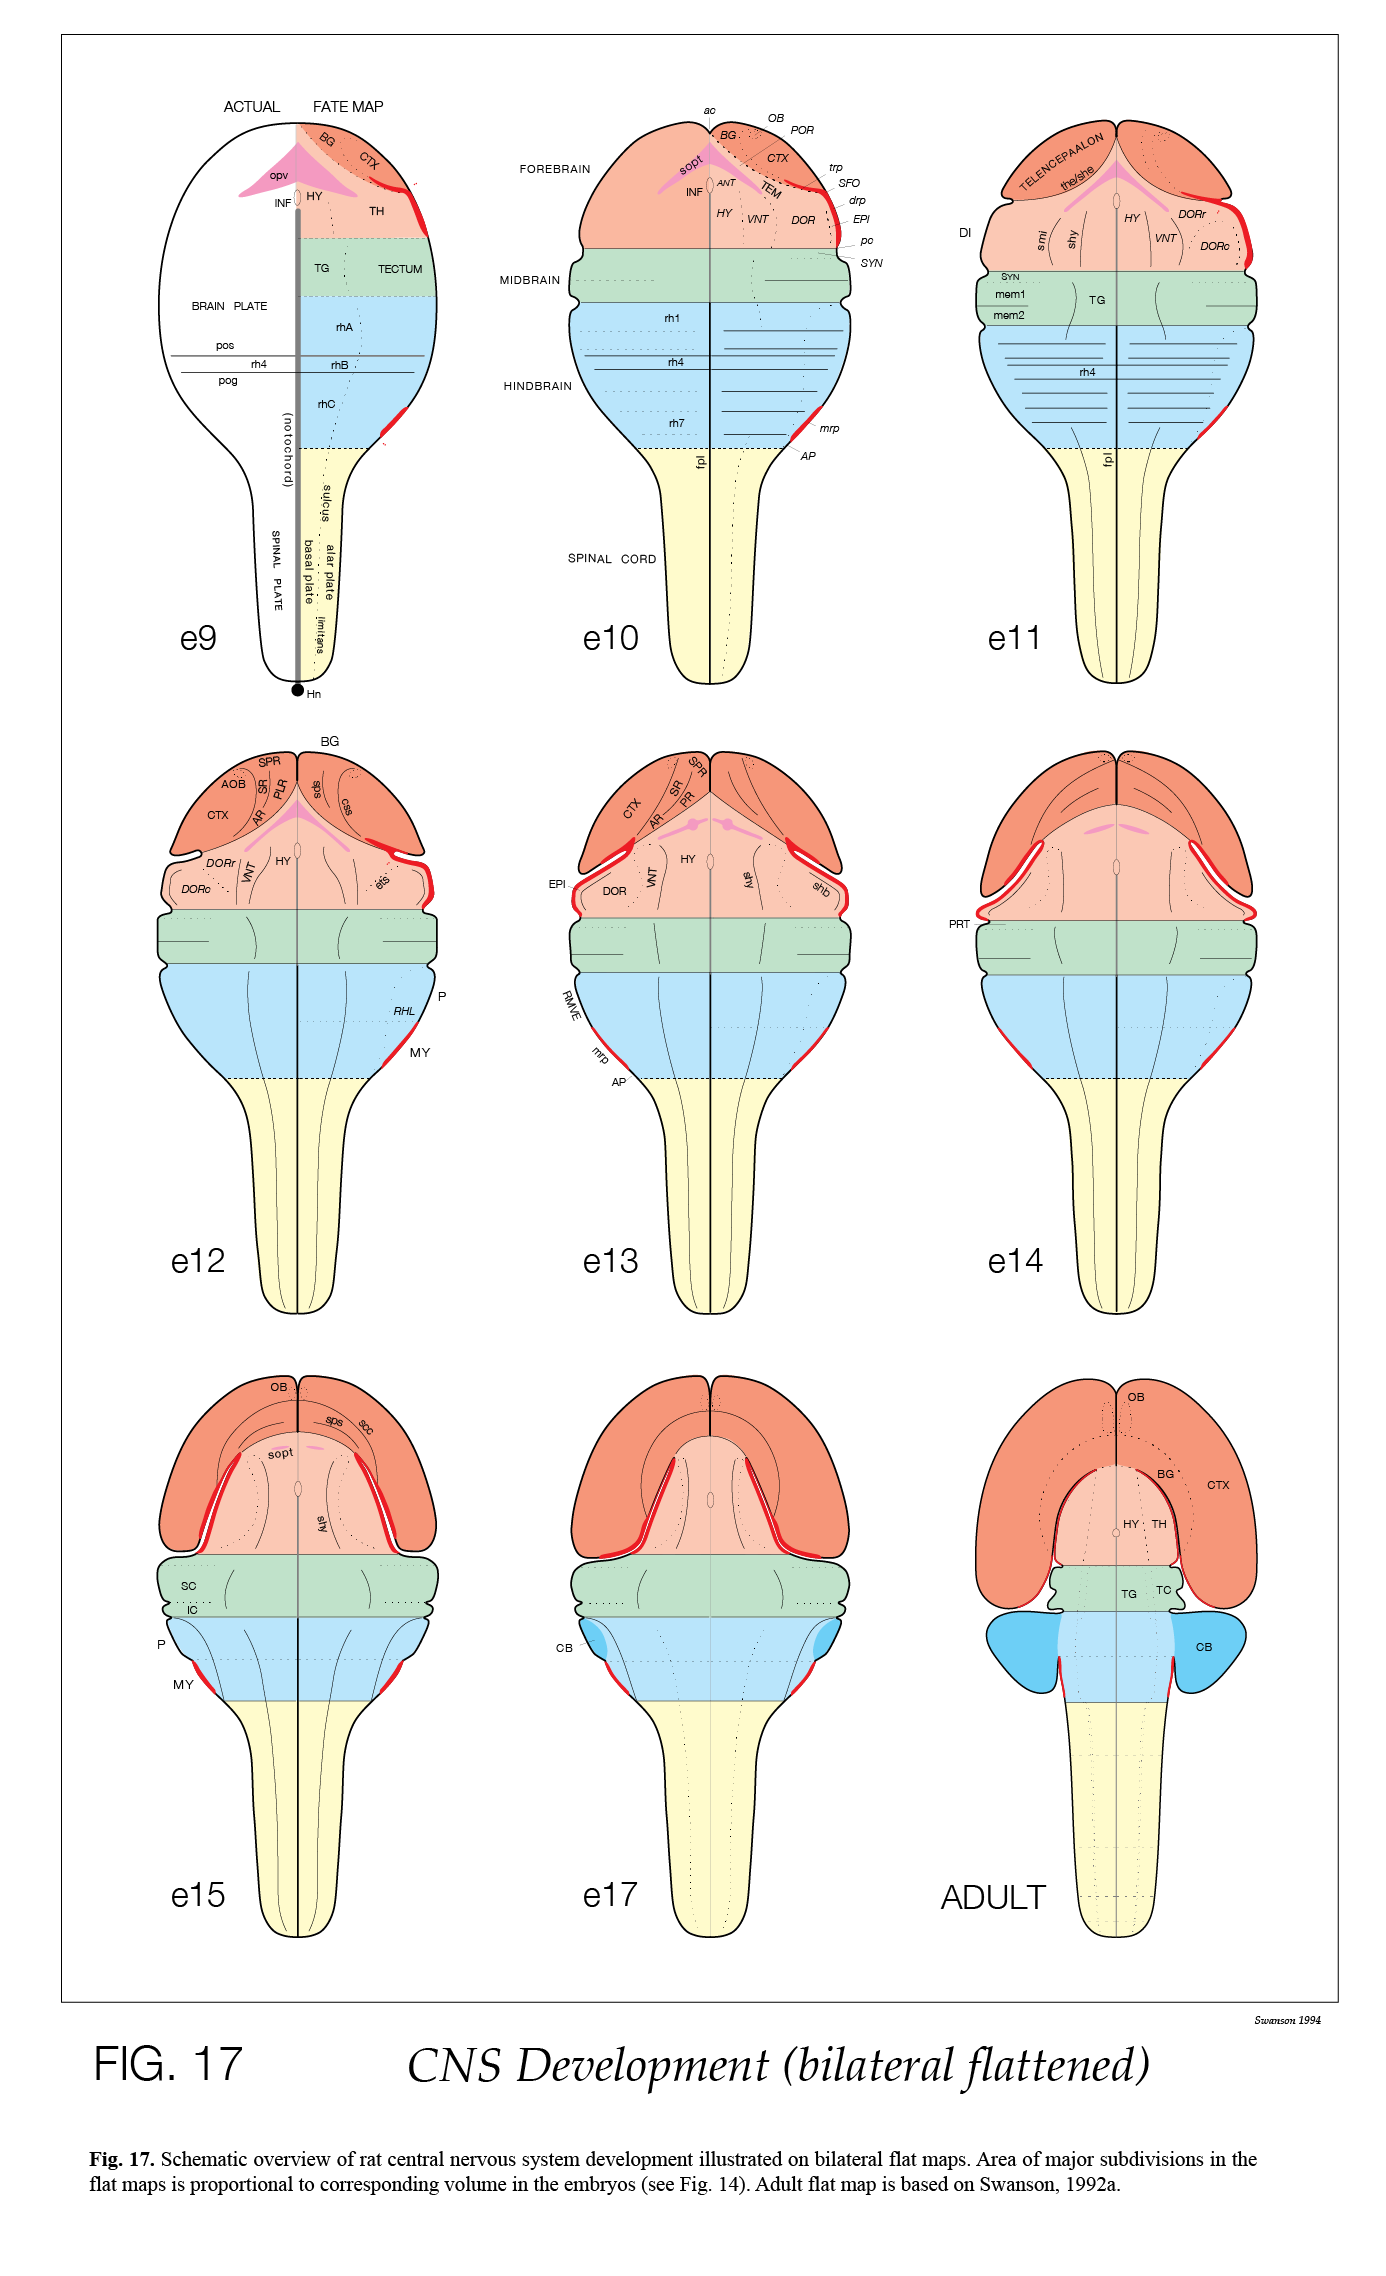 A series of flatmaps from the neural plate stage to the adult central nervous system of the rat; from Alvarez-Bolado & Swanson (1996).
D. MAPPING CONNECTIONS ON STANDARD TEMPLATES
Since 1992, virtually all of the experimental pathway tracing analyses carried out by the Swanson group in rat have been mapped onto standard atlas and flatmap templates from the 3 editions of Brain maps: structure of the rat brain (Swanson, 1992, 1998, 2004). This approach greatly simplifies qualitative comparisons of connection patterns for different parts of the nervous system. The first example was for the connections of the posterior nucleus of the amygdala, and adjacent parts of the cortical nucleus of the amygdala (Canteras et al., 1992):
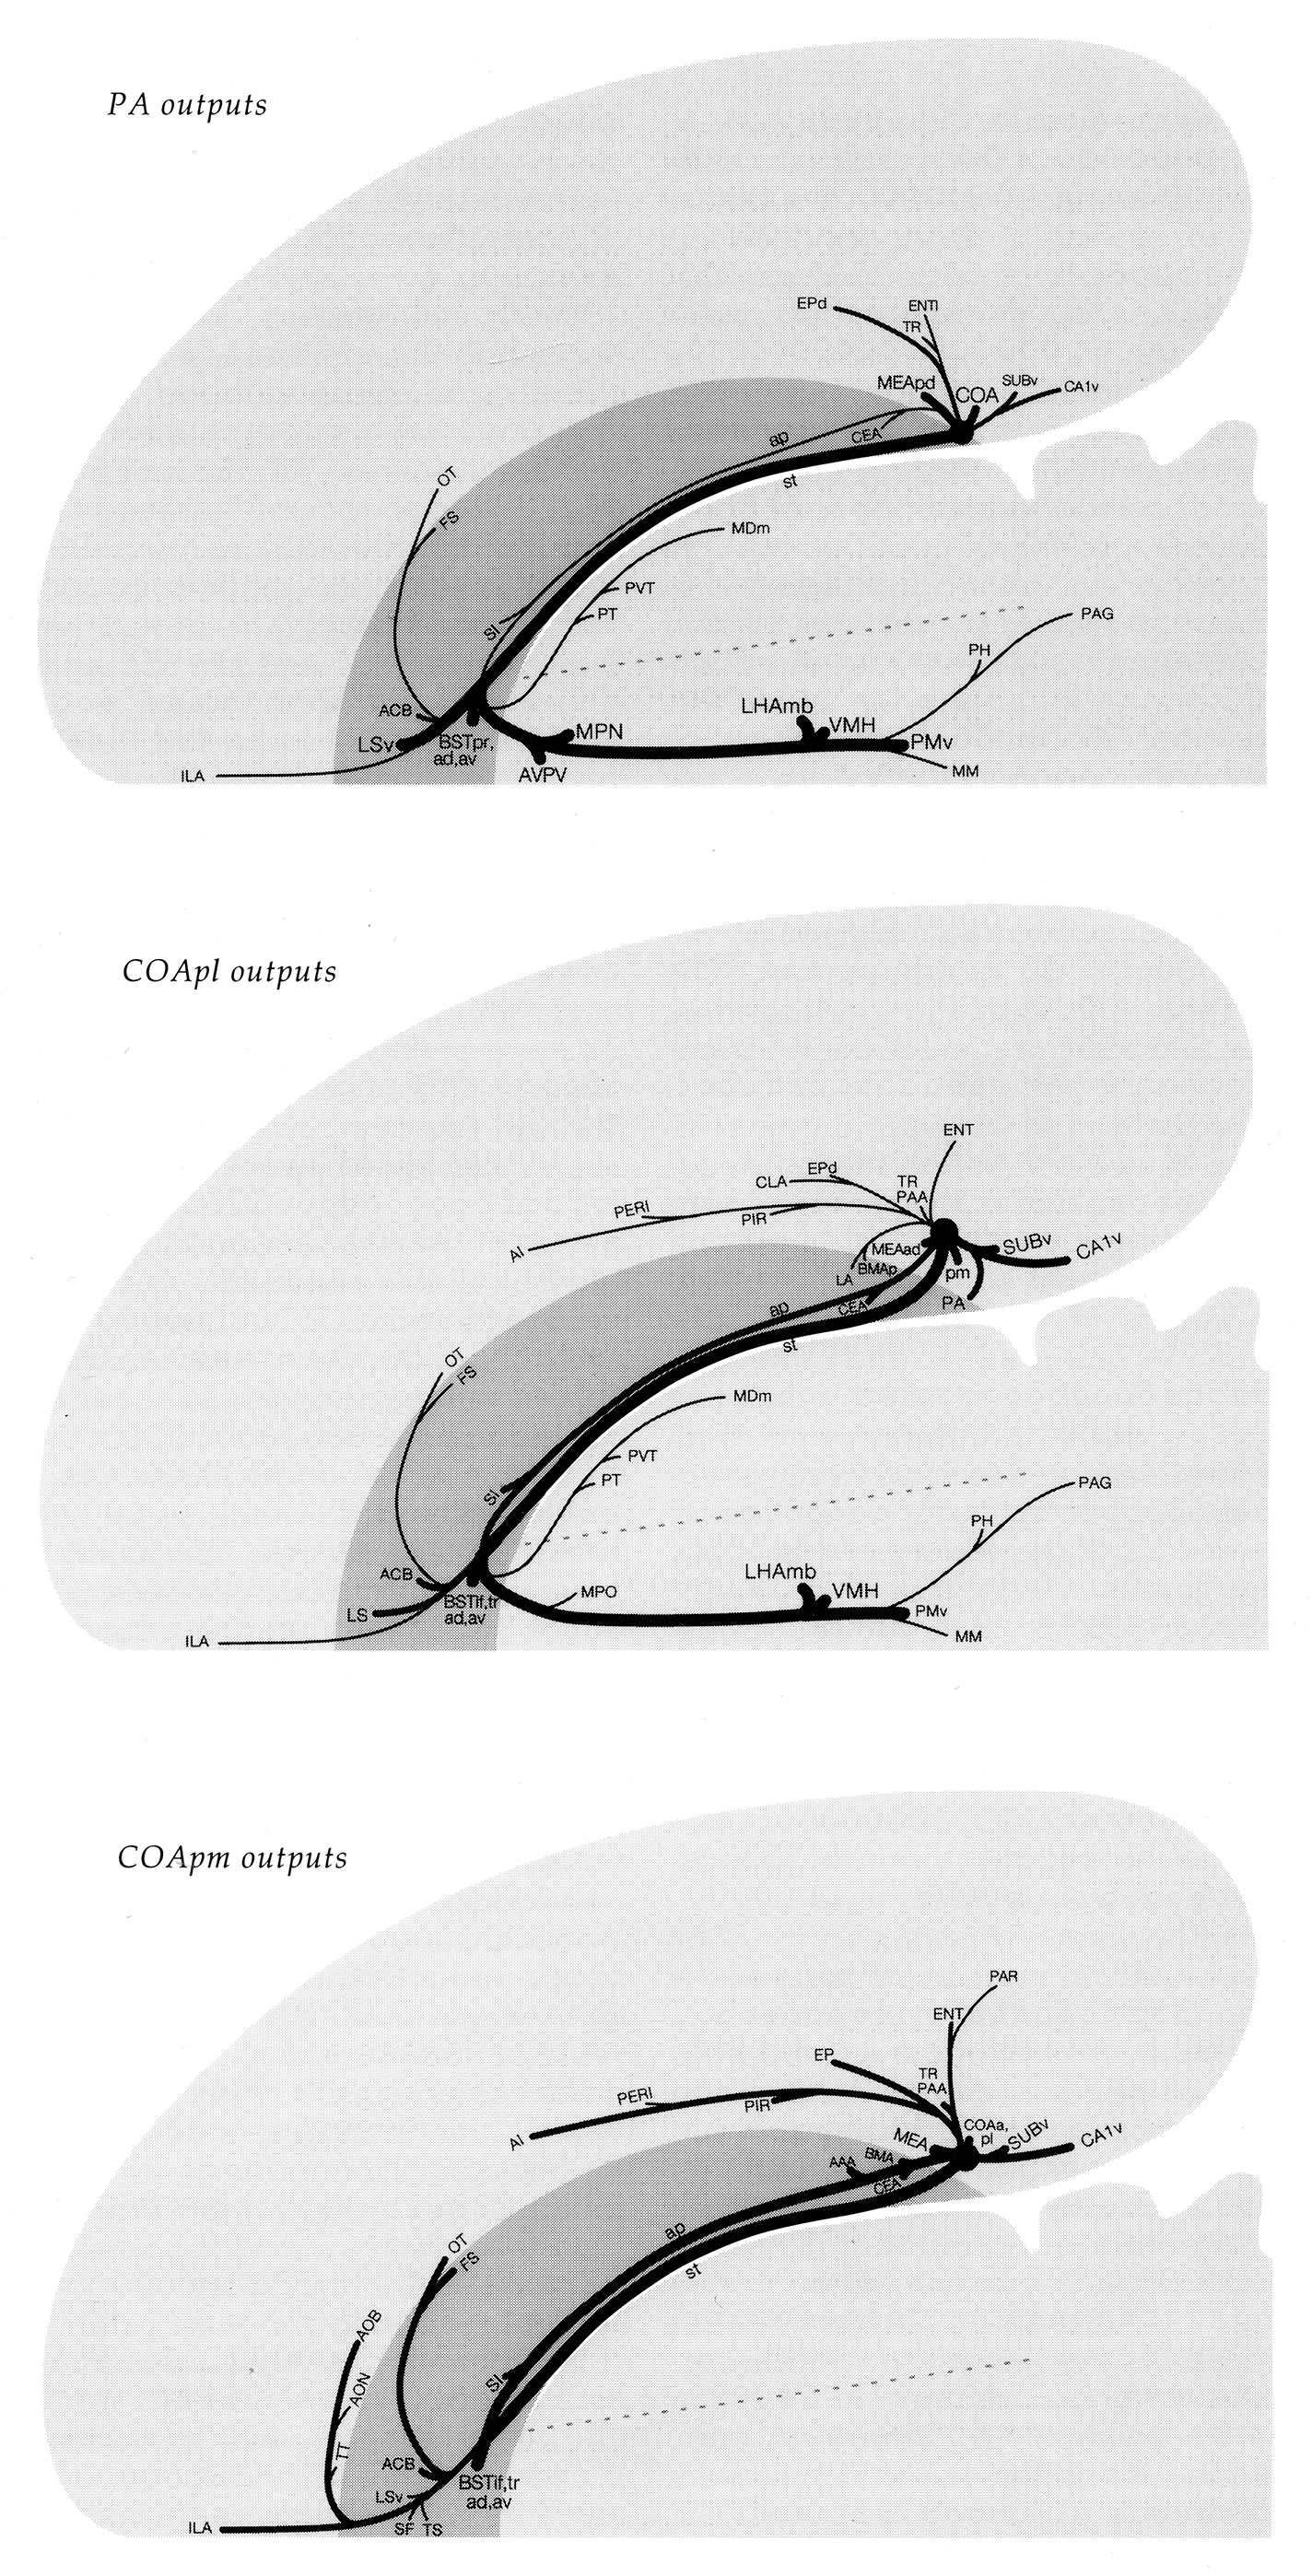 Outputs on a flatmap of rat amygdalar regions (Canteras et al., 1992).
E. A FLATMAP TEMPLATE FOR THE COMPLETE RAT CONNECTOME
A flatmap of the rat nervous system, with all gray matter regions and white matter tracts in the central and peripheral divisions is under development for Brain Maps 4.0. It can be used to display all macroconnections of the system. Here is a preview of the beta version, along with the disposition of dermatomes in the embryo, to emphasize the regularity of spinal nerves:
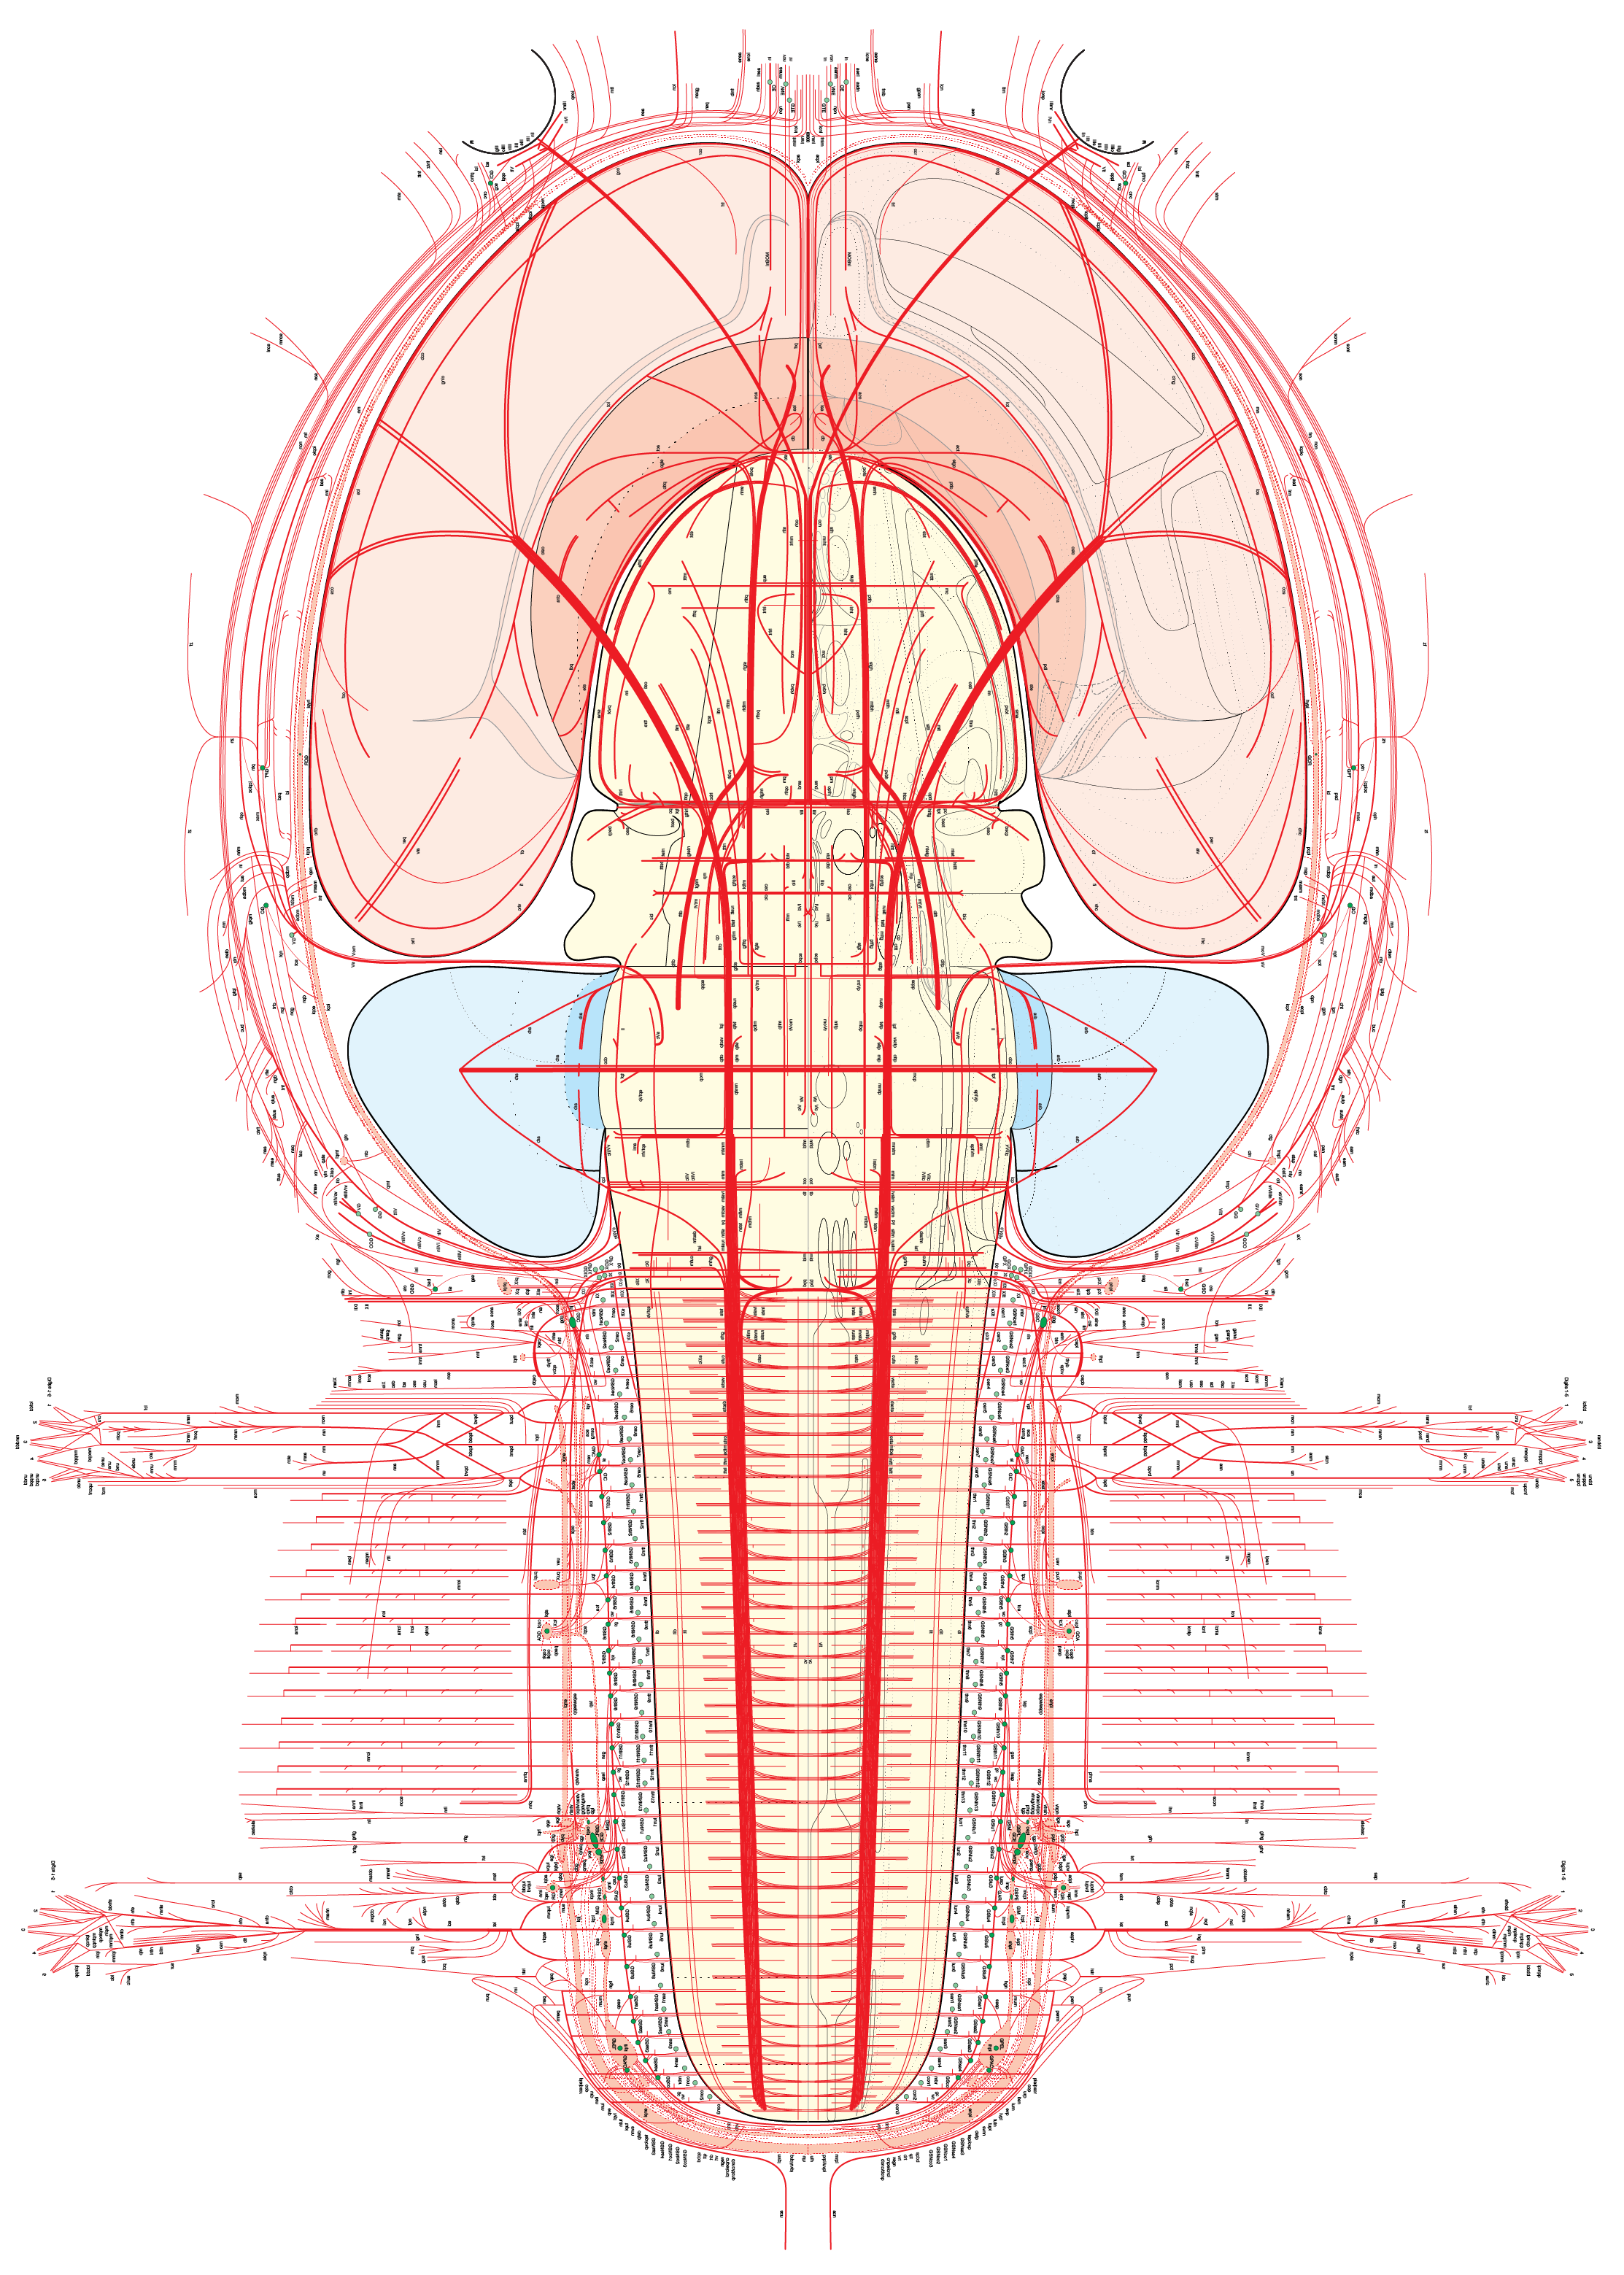 Rat nervous system flatmap (Swanson, L.W., version 4.0 beta3, 2015).
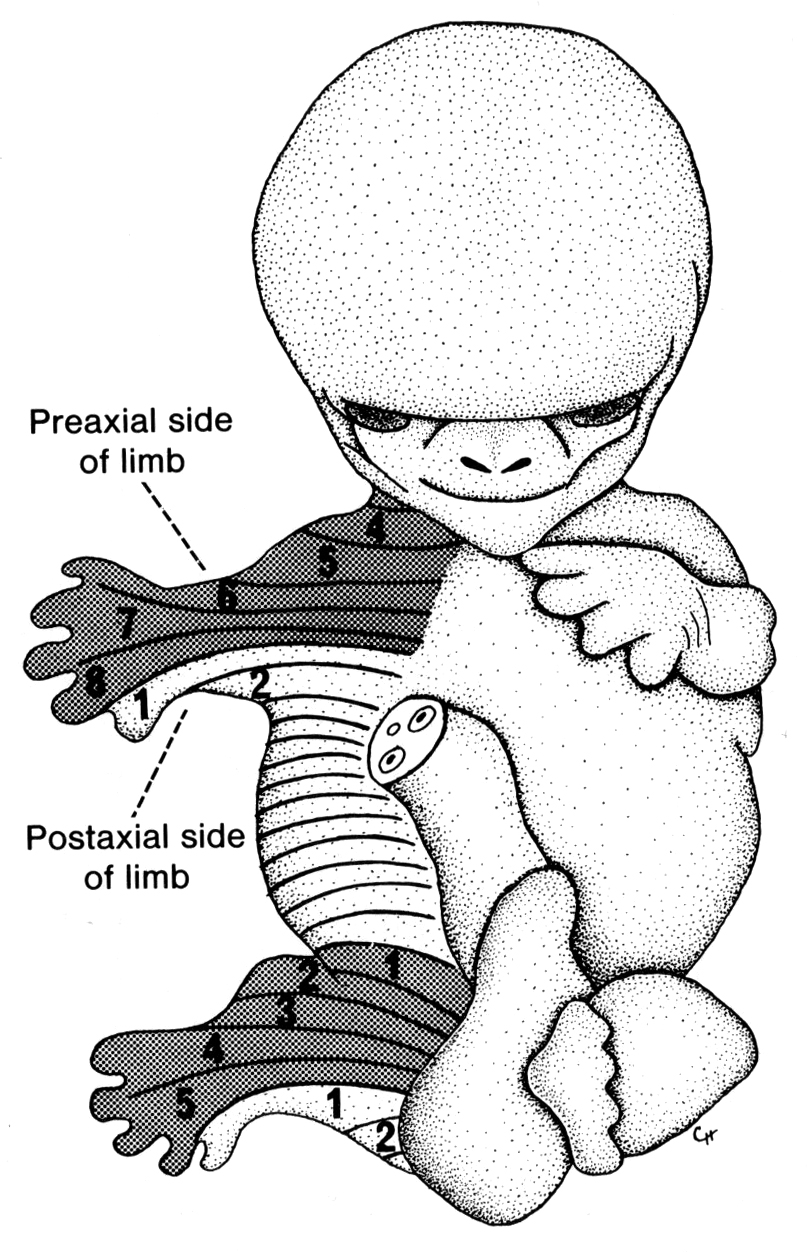 Dermatome pattern in 7 week human embryo; from Sadler, T.W. (1985) Langman’s medical embryology, 5th edition (Baltimore: Williams & Wilkins).
F. REFERENCES
Alvarez-Bolado, G., Rosenfeld, M.G., and Swanson, L.W. (1995) A model of forebrain regionalization based on spatiotemporal patterns of POU-III homeobox gene expression, birthdates, and morphological features. J. Comp. Neurol. 355:237-295.
Alvarez-Bolado, G. & Swanson, L.W. (1996) Developmental brain maps: structure of the embryonic rat brain (Amsterdam: Elsevier).
Canteras, N.S., Simerly, R.B., & Swanson, L.W. (1992) The connections of the posterior nucleus of the amygdala. J. Comp. Neurol. 324:143-179.
Herrick, C.J. (1948) The brain of the tiger salamander, Amblystoma tigrinum (Chicago: University of Chicago Press).
Nauta, W.J.H. & Feirtag, M. (1986) Fundamental neuroanatomy (New York: Freeman).
Nauta, W.J.H. & Karten, H.J. (1970) A general profile of the vertebrate brain, with sidelights on the ancestry of cerebral cortex. In: The neurosciences: second study program, Schmitt, F.O., editor (New York: Rockefeller University Press) pp. 7-26.
Simerly, R.B. & Swanson, L.W. (1988) Projections of the medial preoptic nucleus: a Phaseolus vulgaris leucoagglutinin anterograde tract-tracing study in the rat. J. Comp. Neurol. 270:209-242.
Swanson, L.W. & Hartman, B.K. (1975) The central adrenergic system. An immunofluorescence study of the location of cell bodies and their efferent connections in the rat utilizing dopamine-ß-hydroxylase as a marker. Journal of Comparative Neurology 163:467-506.
Swanson, L.W. (1992) Brain maps: structure of the rat brain (Amsterdam: Elsevier).
Swanson, L.W. (1995) Mapping the human brain: past, present, and future. Trends Neurosci. 18:471-474.
Swanson, L.W. (1998) Brain maps: structure of the rat brain. A laboratory guide with printed and electronic templates for data, models and schematics, 2nd edition (Amsterdam: Elsevier).
Swanson, L.W. (2000) A history of neuroanatomical mapping. In: Brain mapping: the systems, Toga, A.W. & Mazziotta, J.C., editors (San Diego: Academic Press) pp. 77-109.
Swanson, L.W. (2004) Brain maps: structure of the rat brain. A laboratory guide with printed and electronic templates for data, models and schematics, 3rd edition (Amsterdam: Elsevier).
Swanson, L.W. (2012) Brain architecture: understanding the basic plan, 2nd edition (Oxford: Oxford University Press).
Swanson, L.W. (2018) Brain maps 4.0—Structure of the rat brain: an open access atlas with global nervous system nomenclature ontology and flatmaps. Journal of Comparative Neurology. doi: 10.1002/cne.24381.
Swanson, L.W., Wyss, J.M., & Cowan, W.M. (1978) An autoradiographic study of the organization of intrahippocampal association pathways in the rat. J. Comp. Neurol. 181:681-716.