 The rat nervous system (Swanson, 1998)
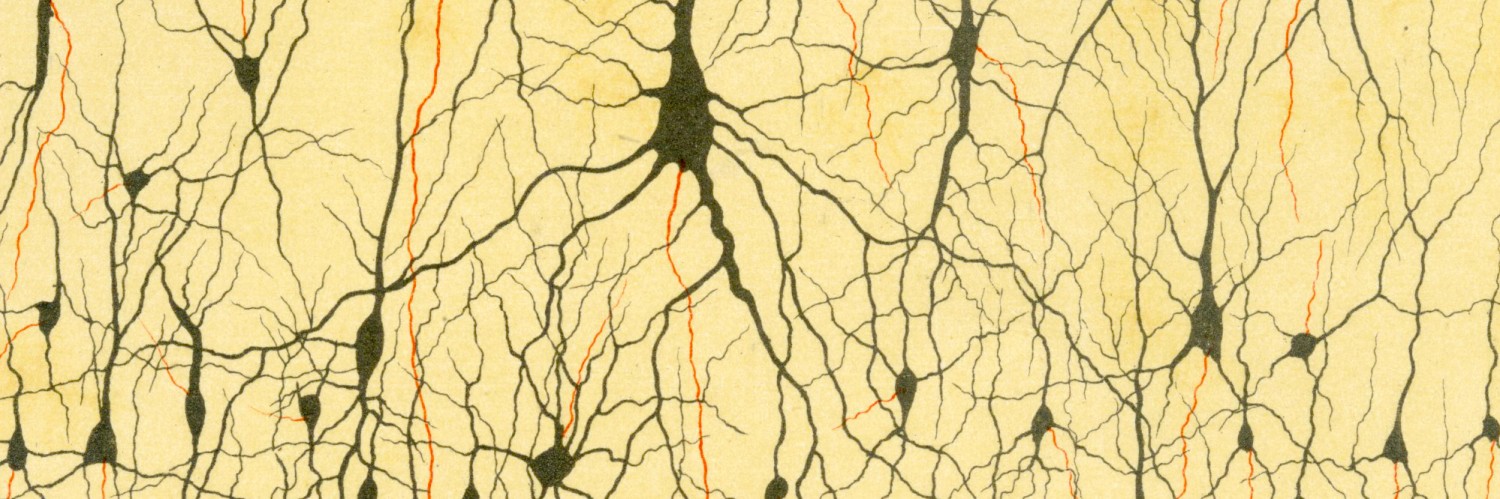
This illustration of the rat nervous system was created for the first edition of Brain maps: structure of the rat brain (Swanson, 1992), and the colored version was used on the cover of the second edition (Swanson, 1998). It’s informative to compare it with the magnificent drawing of the human nervous system by Vesalius at the top of the Connectome page, and with the conceptualized flatmap representation of the rat nervous system below.
Larry Swanson and Mihail Bota began a systematic analysis of the rat neurome (the complete nervous system connectome and its connections with the rest of the body) around 2013, starting with the cerebral cortex at the rostral end of the central nervous system. Olaf Sporns has collaborated since the beginning with network analysis strategies, and Joel Hahn joined the collation and analysis effort in 2015. Currently the team consists of Larry Swanson, Joel Hahn, and Olaf Sporns.
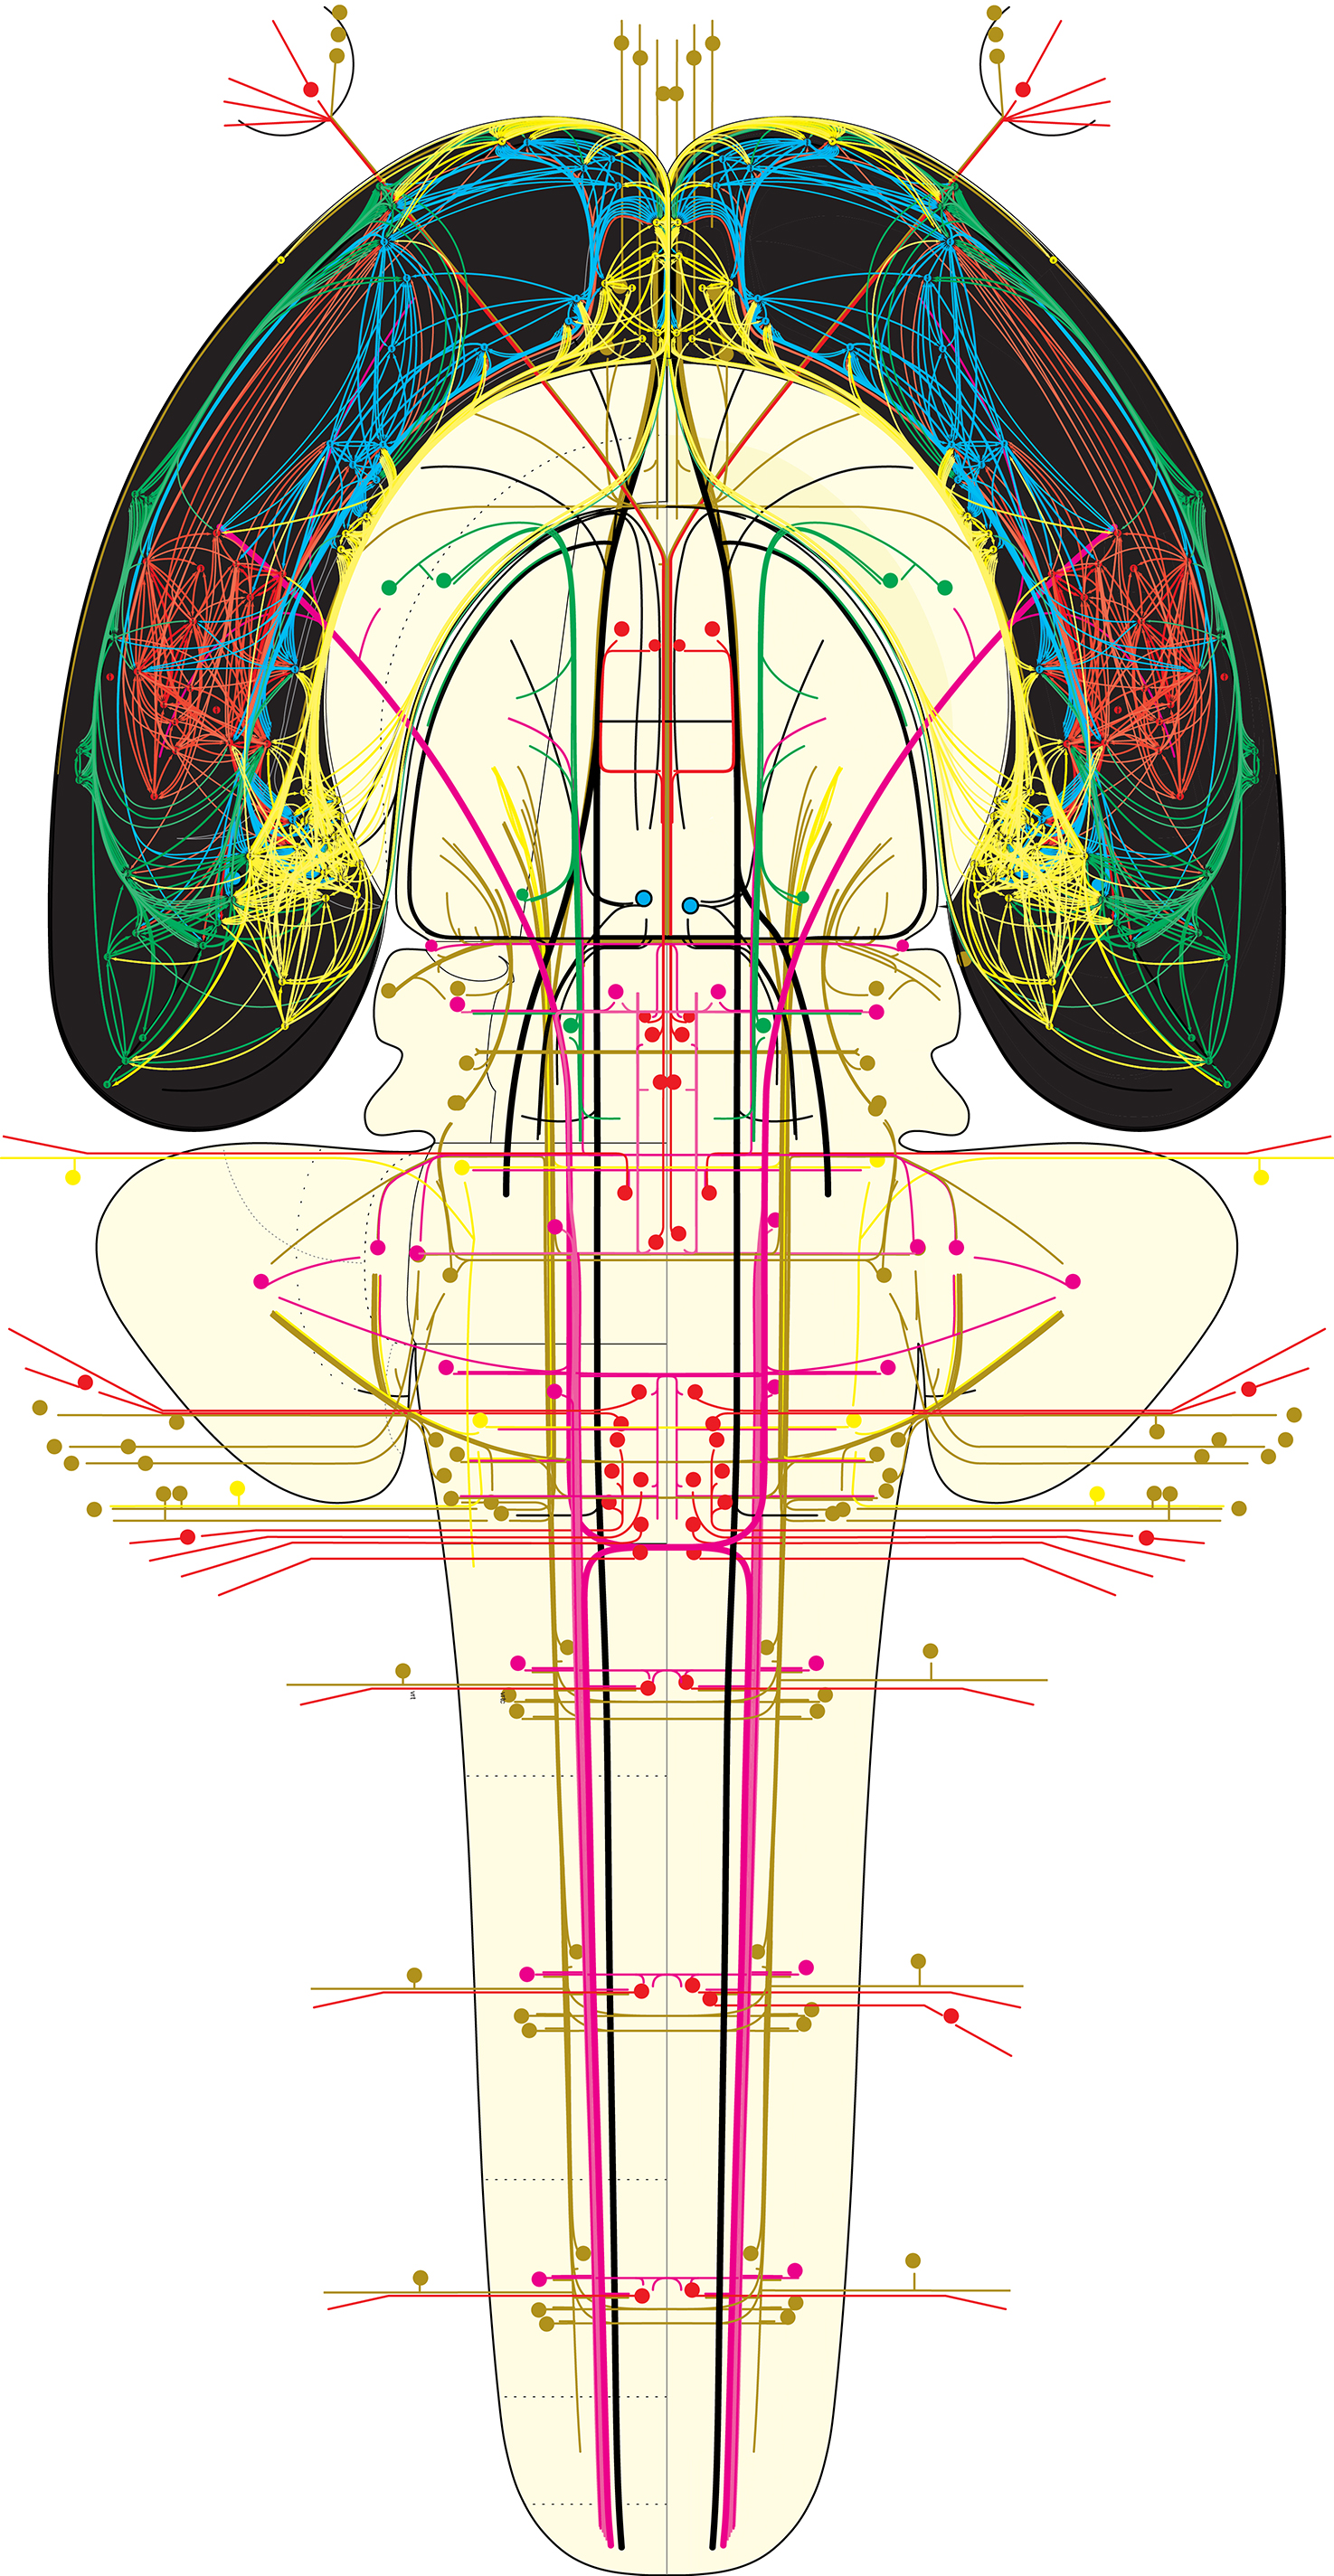
Here is Larry’s first article on the topic, followed by an illustration of the results (cortical association circuitry version 1.0, highlighted with a black background) presented in the context of a central nervous system flatmap that shows the major white matter tracts (central and peripheral) of the nervous system as a whole. PDF of the illustration below (can be opened in Adobe Illustrator):
Bota M, Sporns O, Swanson LW (2015) Architecture of the cerebral cortical association connectome underlying cognition. Proceedings of the National Academy of Sciences 112:E2093-E2101. Download the article (PDF). Download the connectome flatmap illustration (Figure 6—and Figure S4) in PDF format that can be opened and edited in Adobe Illustrator.
The extent of the first phase of The Neurome Project is shown below in the connectome of the whole central nervous system, with its matrix of 503 gray matter regions, on the right (B). The topological relationship of the four cortical association connection modules are shown in (A), color coded as in the preceding flatmap illustration of central nervous system connections, with the cortical association connections at the top.
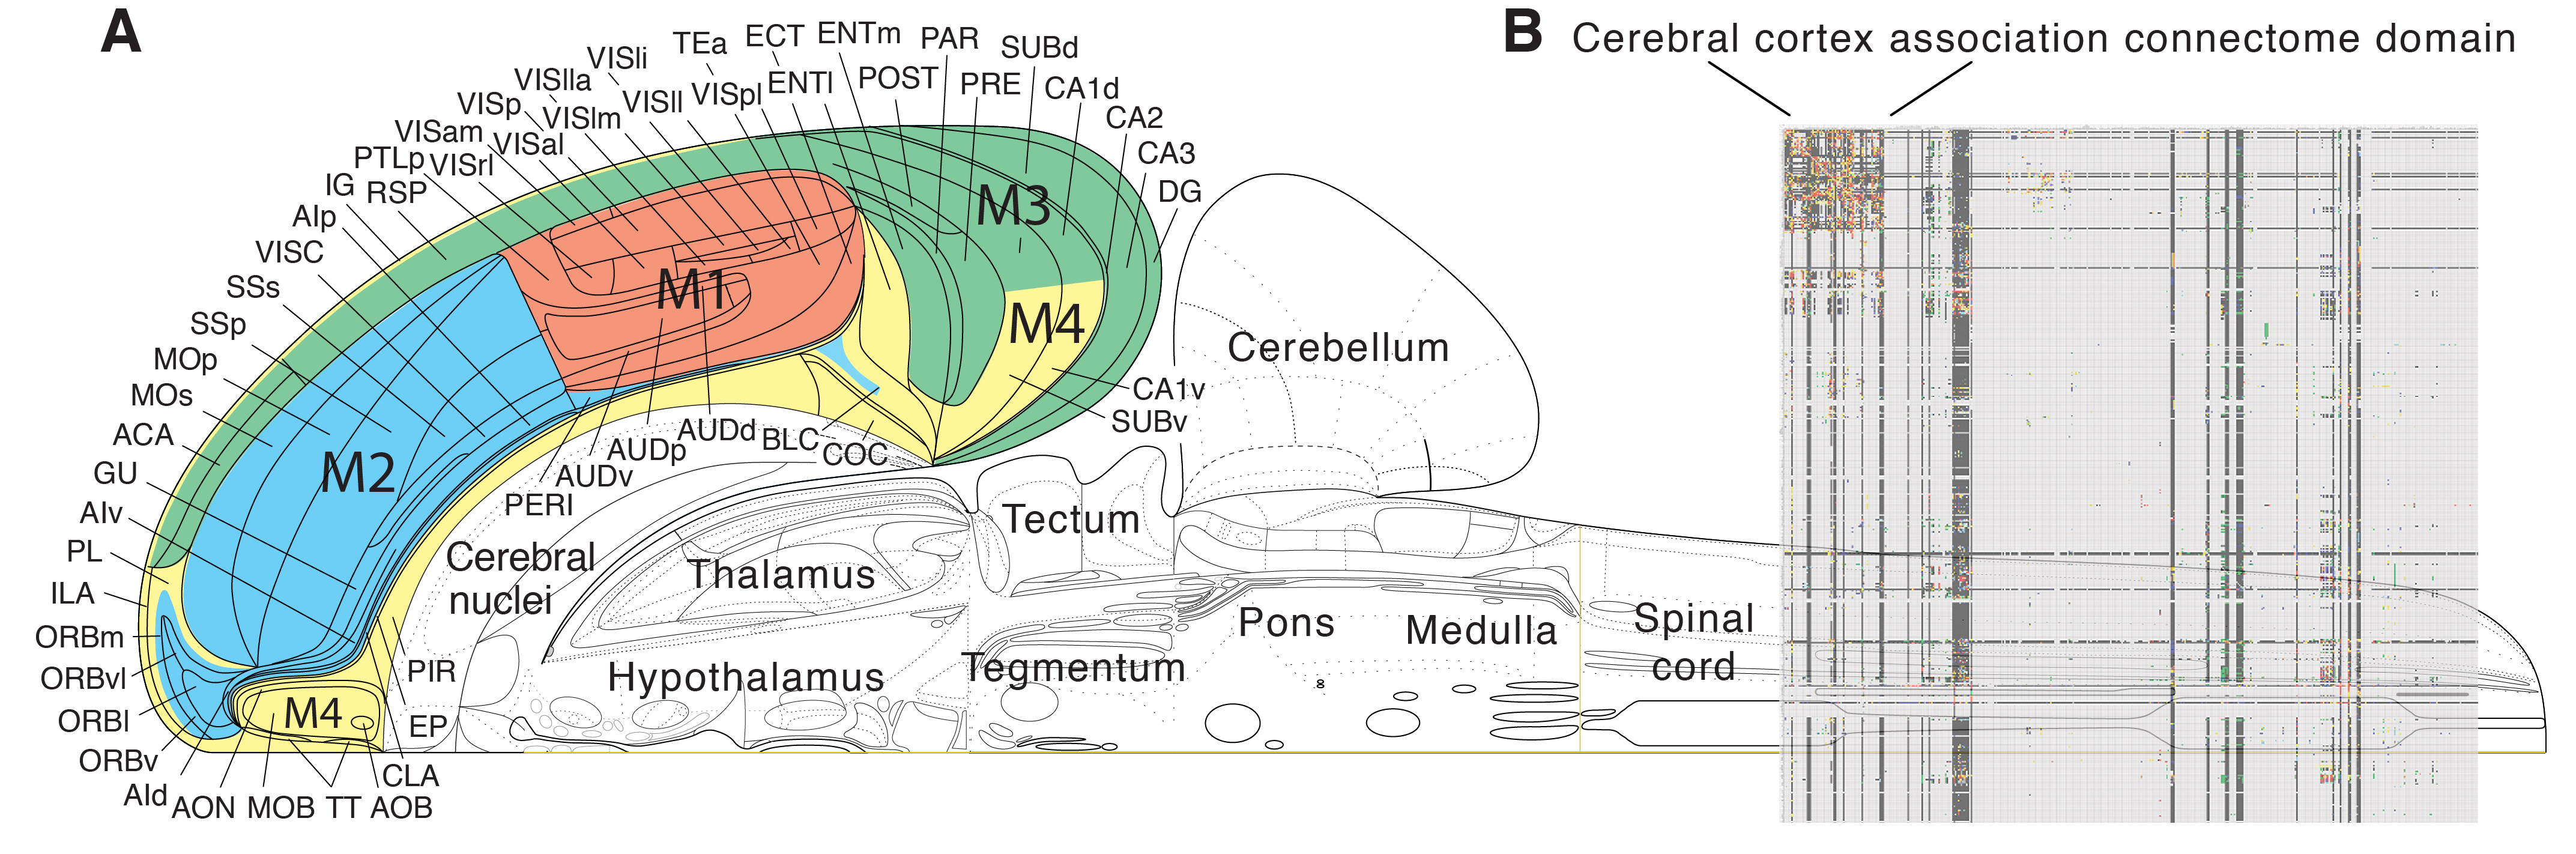 From Bota et al. (2015)
The second phase was published in 2016, and it deals with the ipsilateral (association) and contralateral (commissural) macroconnections of the rat cerebral nuclei (basal ganglia), which consist of 45 gray matter regions on each side of the brain. Click here to read the exciting results of this network analysis.
The third phase was published in 2017, and it deals with commissural connections of the cerebral cortex, as well as version 2.0 of the association connections. It is thus a global analysis of the intrinsic macroconnections of the right and left cerebral cortex. Click here for a copy of this paper. PNAS 2017 Cerebral cortex
Up next is an analysis of the intrinsic connections of the right and left cerebral hemispheres, that is, the right and left cerebral cortex and right and left cerebral nuclei. The cerebral hemispheres are also called the endbrain or telencephalon (in Latin). This paper is being written, and data has been collected for the intrinsic connections of the hypothalamus (by Joel Hahn) and thalamus (by Larry Swanson).
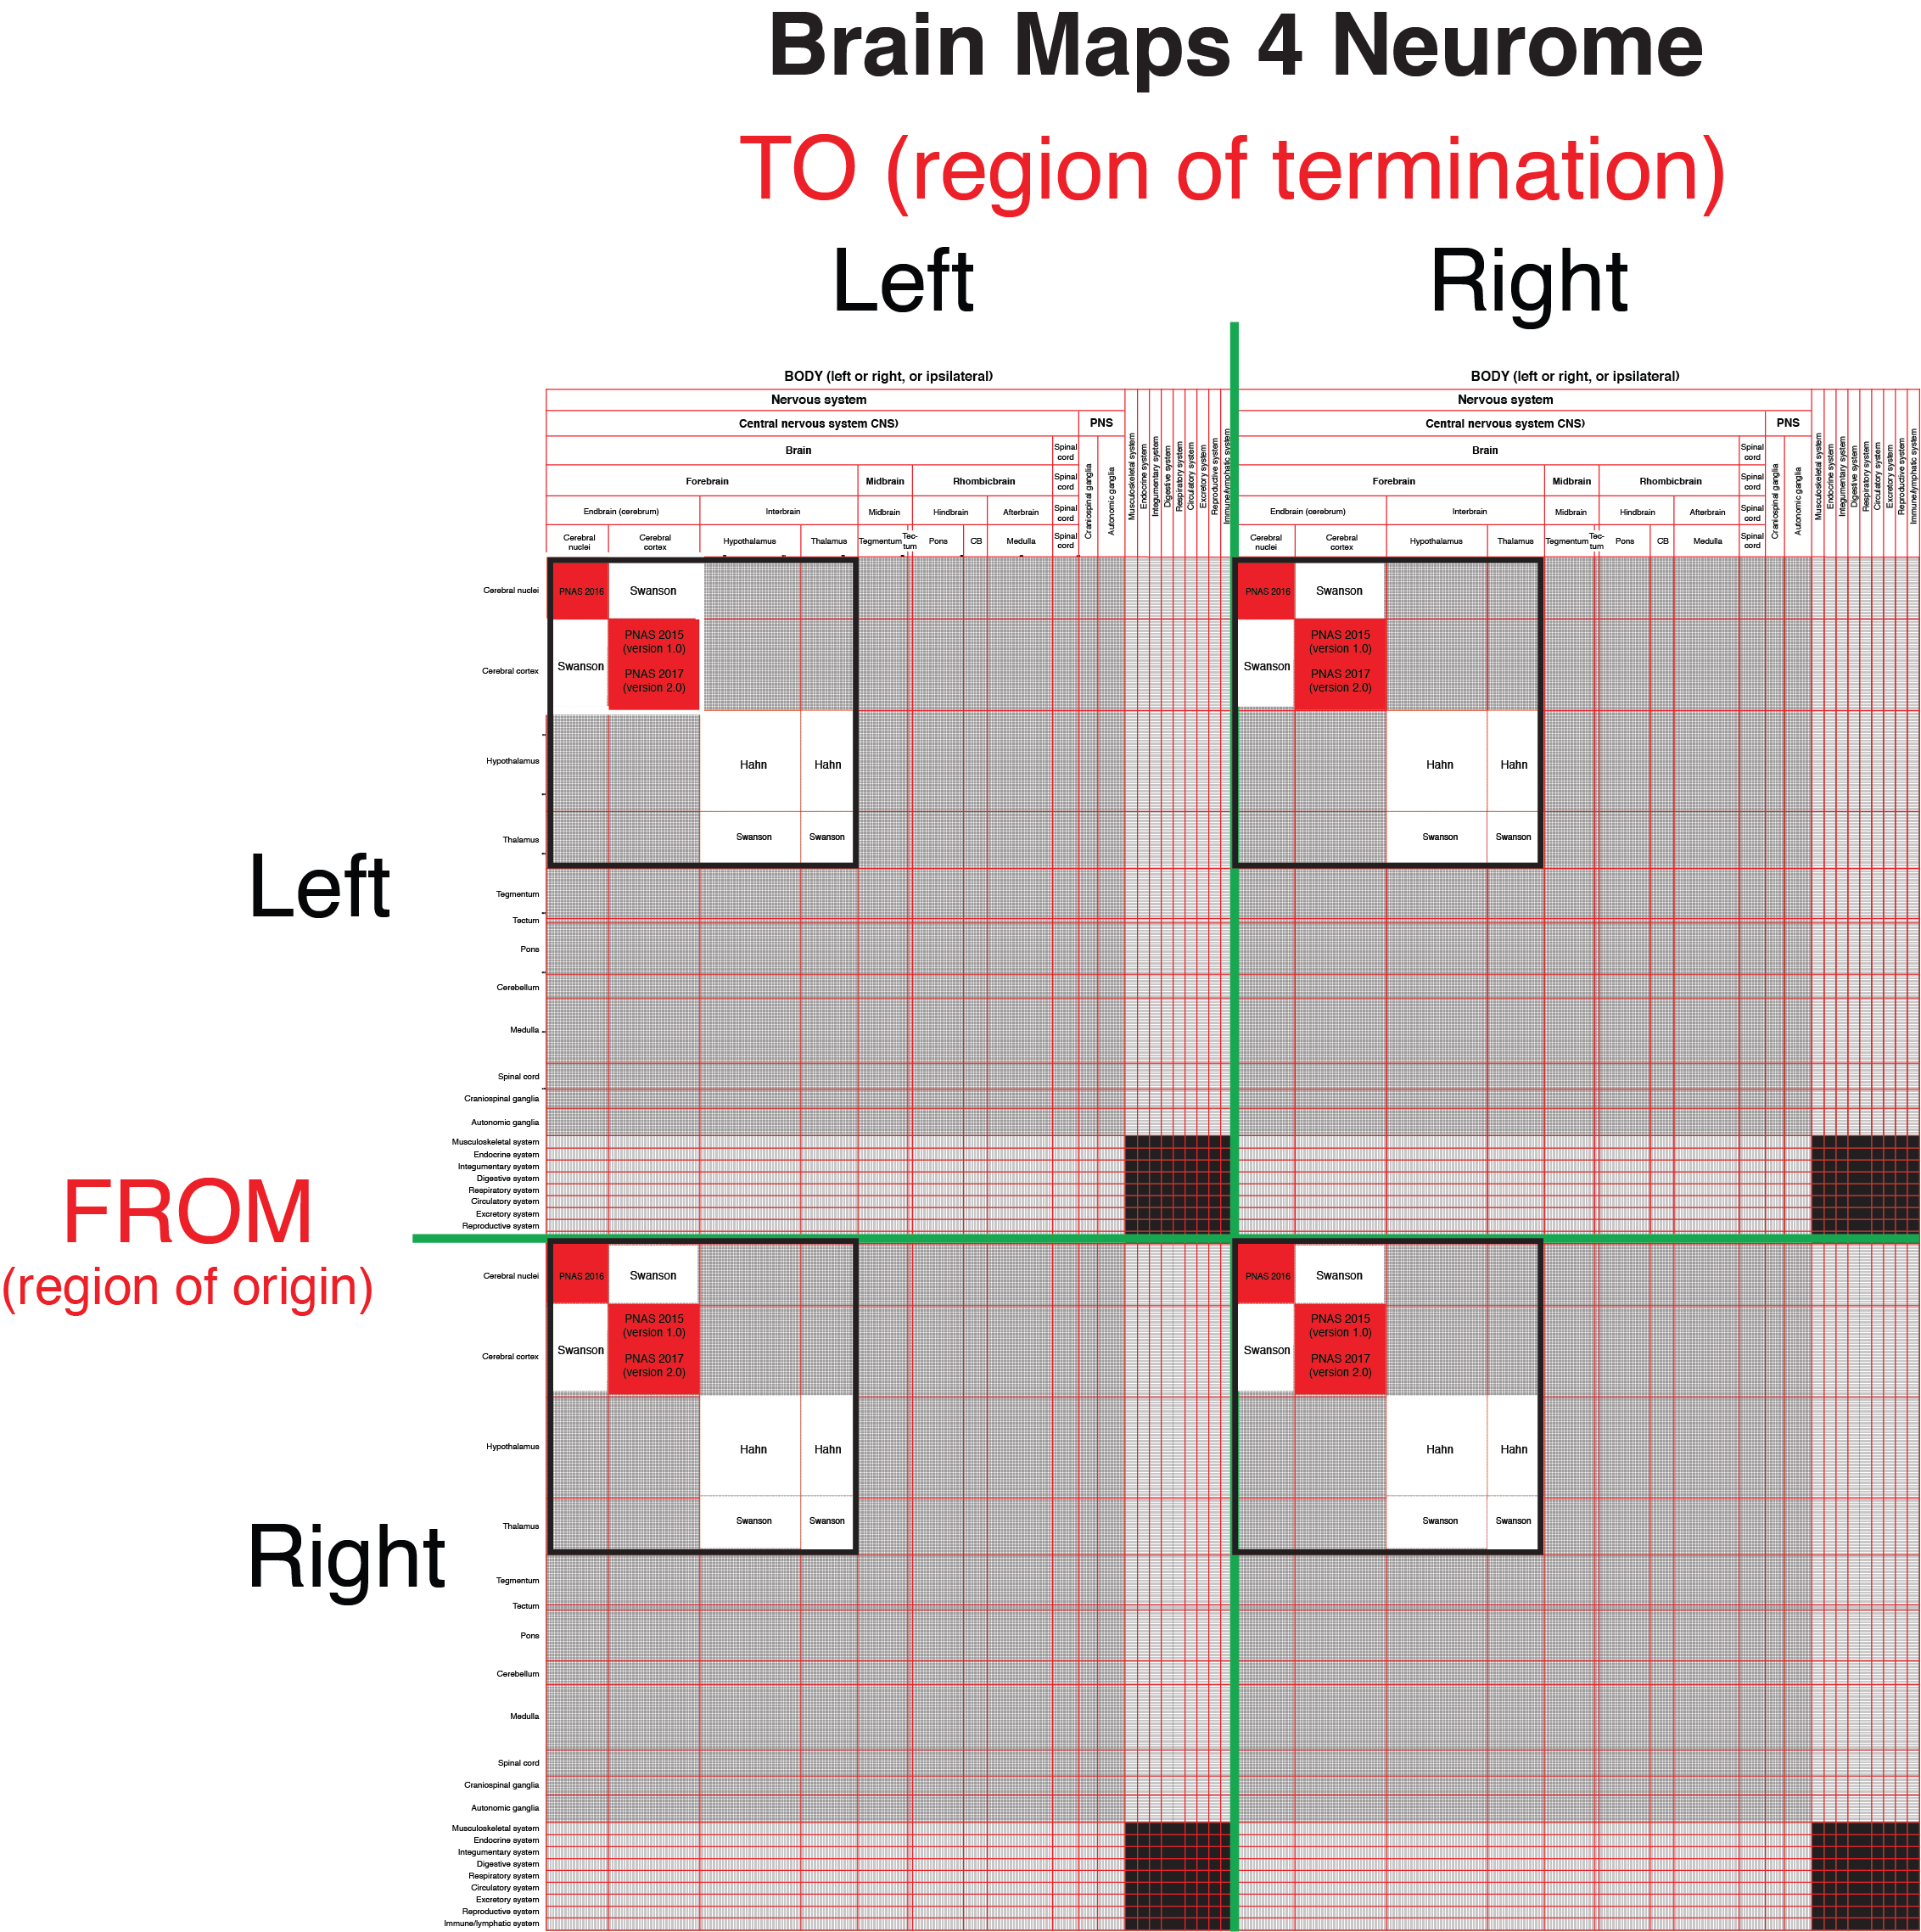
Here is an overview of progress on the Rat Neurome Project so far:
Neurome progress 2018 January
Nomenclature for further development of the Rat Neurome Project is based on the fourth edition of Brain Maps.
See Connection Terminology for a defined vocabulary used in describing accurately the distribution of anatomical (structural) connectivity in the nervous system. This is a critically important tool in constructing and populating any neuroinformatics database and knowledge management system with inference engines. See Network Science for a complementary glossary of terms used for network analysis (graph theory).
Visit The Neurome Project for a very useful array of information, including references to published connections in the rat.
Here is a list of directly relevant publications from Larry’s group:
1. Bota, M., Dong, H.-W., & Swanson, L.W. (2003) From gene networks to brain networks. Nature Neuroscience 6:795-799.
2. Simmons, D.M. & Swanson, L.W. (2009) Comparison of the spatial distribution of seven types of neuroendocrine neurons in the rat paraventricular nucleus: toward a global 3-D model. Journal of Comparative Neurology 516:423-441.
3. Thompson, R.H. & Swanson, L.W. (2010) Hypothesis-driven structural connectivity analysis supports network over hierarchical model of brain architecture. Proceedings of the National Academy of Sciences USA 107:15235-15239.
4. Bota, M., Dong, H.-W., & Swanson, L.W. (2012) Combining collation and annotation efforts toward completion of the rat and mouse connectomes in BAMS. Frontiers in Neuroinformatics 6:1-10.
5. Bota, M., Sporns, O., & Swanson, L.W. (2012) Neuroinformatics analysis of molecular expression patterns and neuron populations in gray matter regions: the rat BST as a rich exemplar. Brain Research Reviews 1450:174-193.
6. Bota, M., Sporns, O, & Swanson, L.W. (2015) Architecture of the cerebral cortical association connectome underlying cognition. Proceedings of the National Academy of Sciences USA 112:E2093-E2101.
7. Swanson, L.W., Sporns, O., & Hahn, J.D. (2016) Network architecture of the cerebral nuclei (basal ganglia) association and commissural connectome. Proceedings of the National Academy of Sciences USA 113:E5972-E5981.
8. Swanson, L.W. & Lichtman, J.W. (2016) From Cajal to connectome and beyond. Annual Review of Neuroscience 39:197-216.
9. Swanson, L.W., Hahn, J.D., & Sporns, O. (2017) Organizing principles for the cerebral cortex network of commissural and association connections. Proceedings of the National Academy of Sciences USA 114:E9692-9701.
10. Swanson, L.W. (2018) Brain maps 4.0-Structure of the rat brain: an open access atlas with global nervous system nomenclature ontology and flatmaps. Journal of Comparative Neurology. doi: 10.1002/cne.24381.